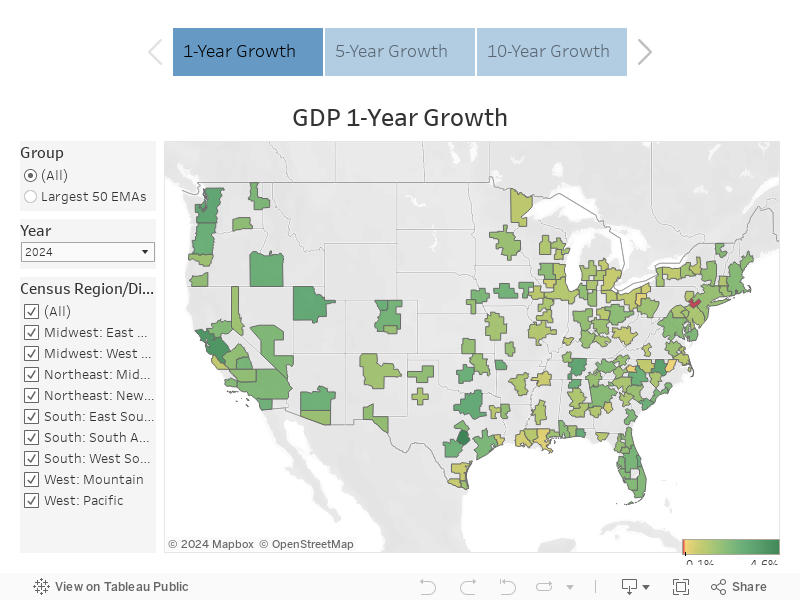
Extended Metropolitan Area GDP Growth Rates
This map visualizes GDP growth rates for 150 Extended Metropolitan Areas (EMAs), with options to view a forecast of the one-year GDP growth rate for 2025 and to see how GDP has changed over a one-, five- or 10-year period.
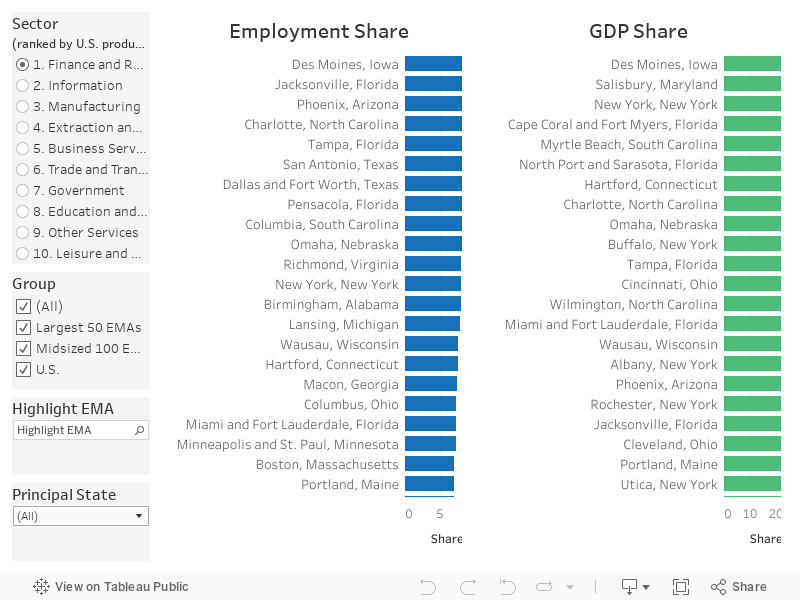
Sector-Specific Employment and GDP Shares
These charts show the employment and GDP shares of selected sectors for every EMA economy.
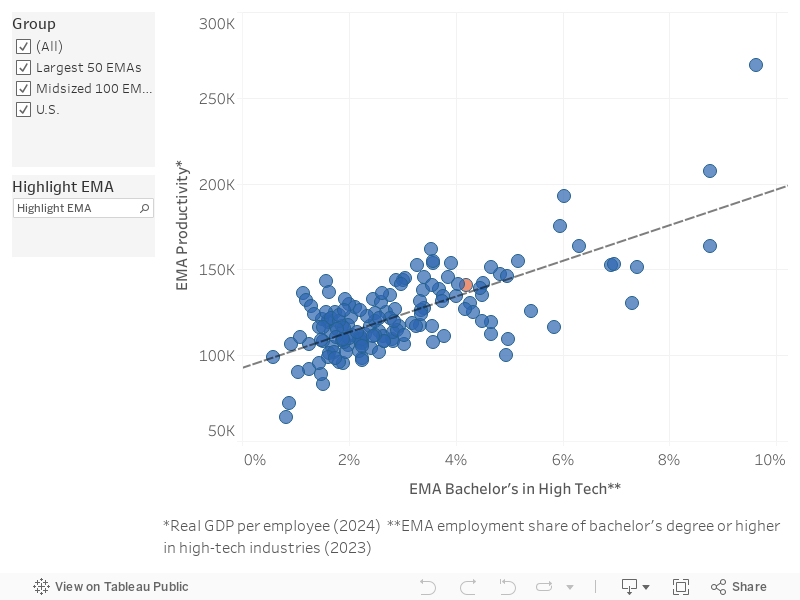
Productivity Powered by Educated Tech Workers
This chart shows the relationship between an EMA’s labor productivity and the share of its workforce in high-tech industries with a bachelor’s degree or higher.
10-Year Productivity Performance
This chart shows EMA productivity growth over a 10-year period, from 2015 through the 2025 forecast.
UPDATED AS OF JANUARY 2025