Hurricane Helene caused significant damage in Western North Carolina communities, and the time and effort required for economic recovery will vary across counties and neighborhoods. This dashboard provides data in near real-time to measure economic activity and recovery at county and subcounty levels, wherever possible. By comparing current economic indicators with the same period in previous years, the dashboard offers an accessible way for policymakers, government organizations and others to track progress, evaluate pilot recovery programs and make informed decisions to support continuing recovery efforts.
On the Road Again?
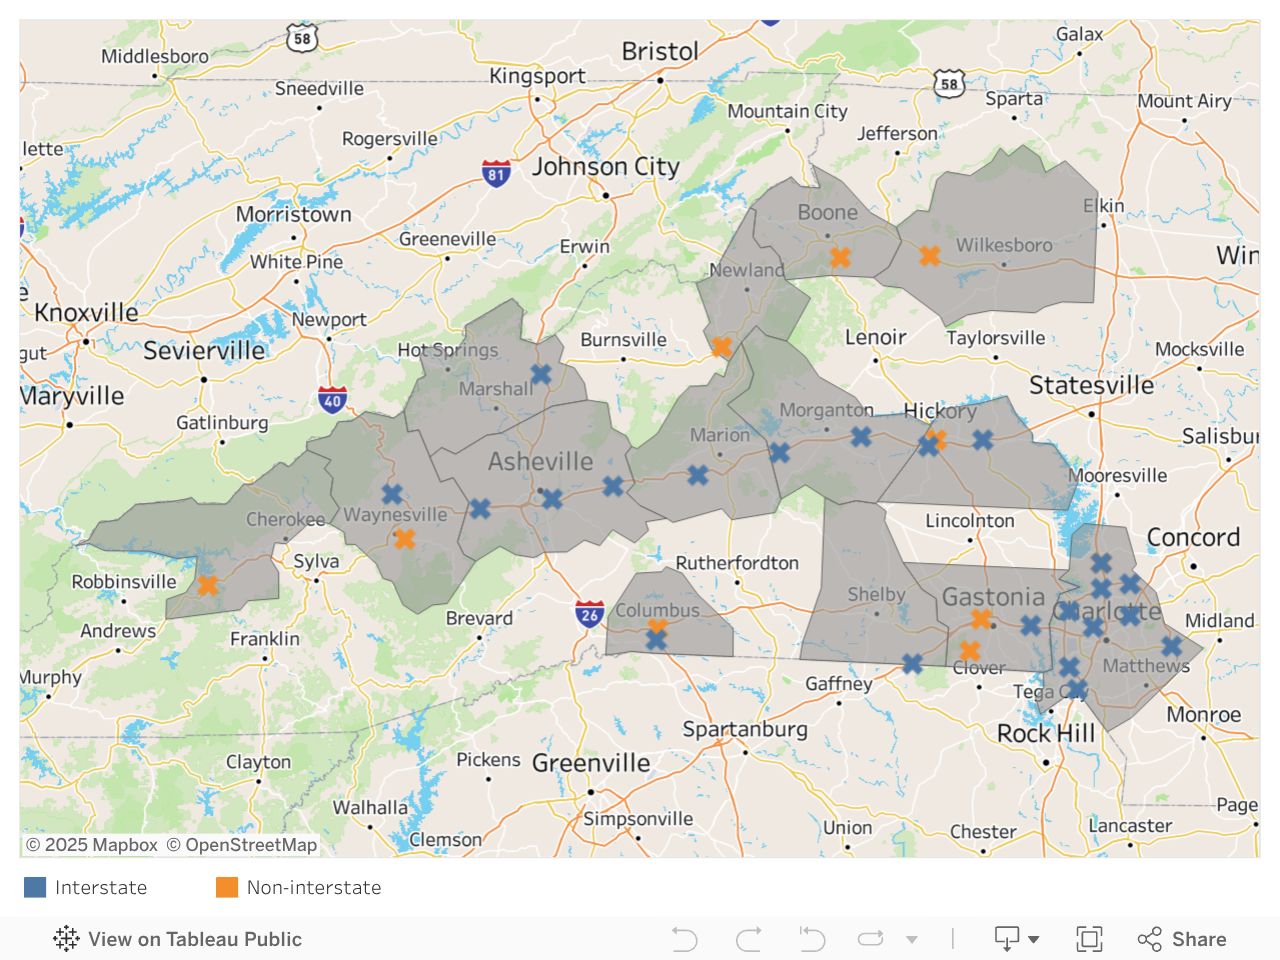
Post-Hurricane Traffic Analysis: County-Level Flows in Western NC
While the traffic data show patterns of movement through Western North Carolina, they raise important questions about the region’s recovery. Are drivers stopping and contributing to local economies or simply passing through? Low traffic on certain routes may reflect continuing road closures, but it could also indicate that nearby businesses remain shuttered or that travelers believe they are. Understanding these nuances is key to interpreting what the traffic data reveal about the region’s broader economic recovery.
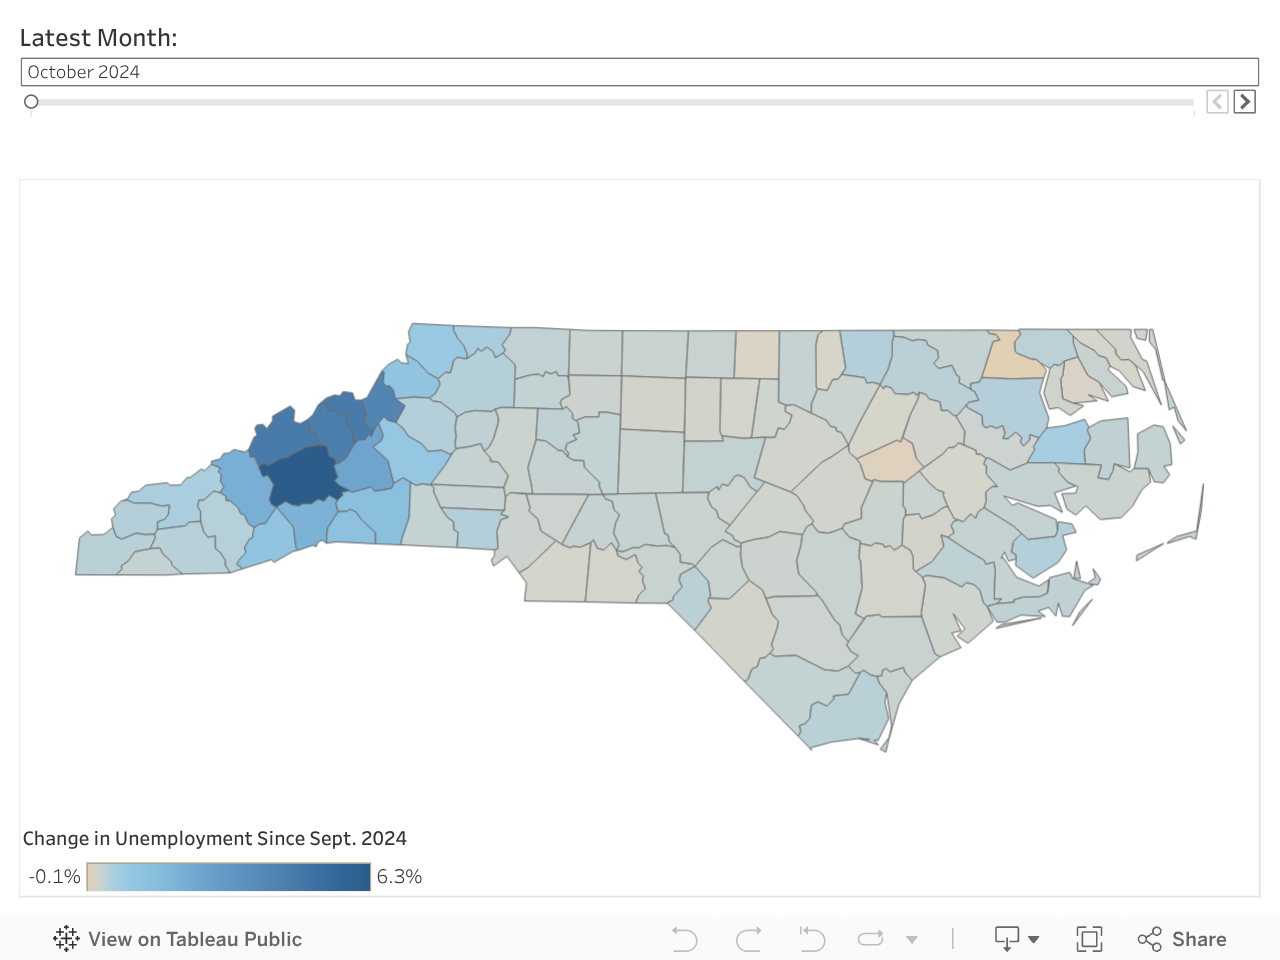
Helene’s Impact on Western North Carolina Employment
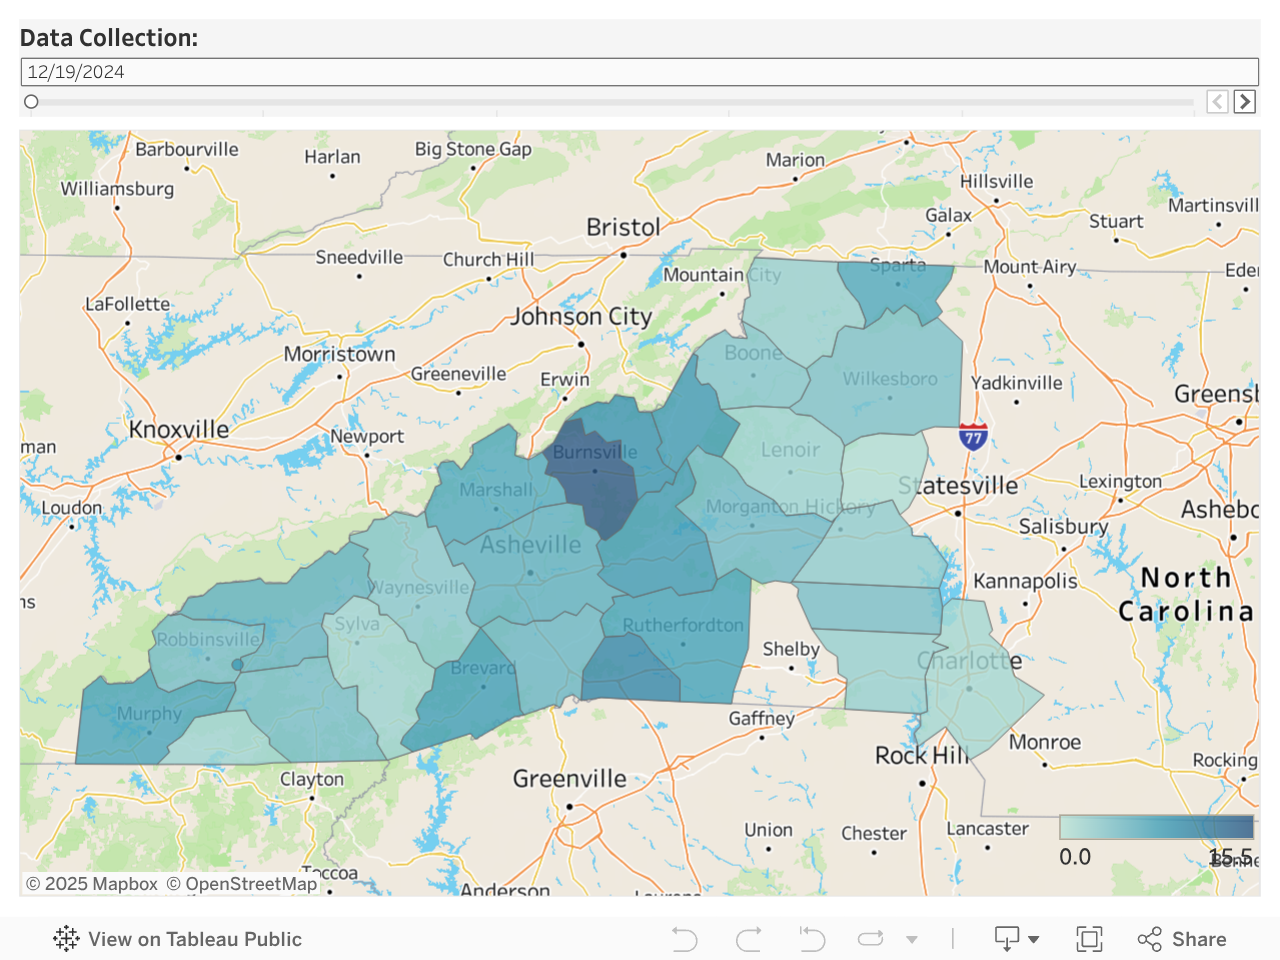
Restaurant Closures
Percent of Restaurants Closed Likely Due to Hurricane Helene
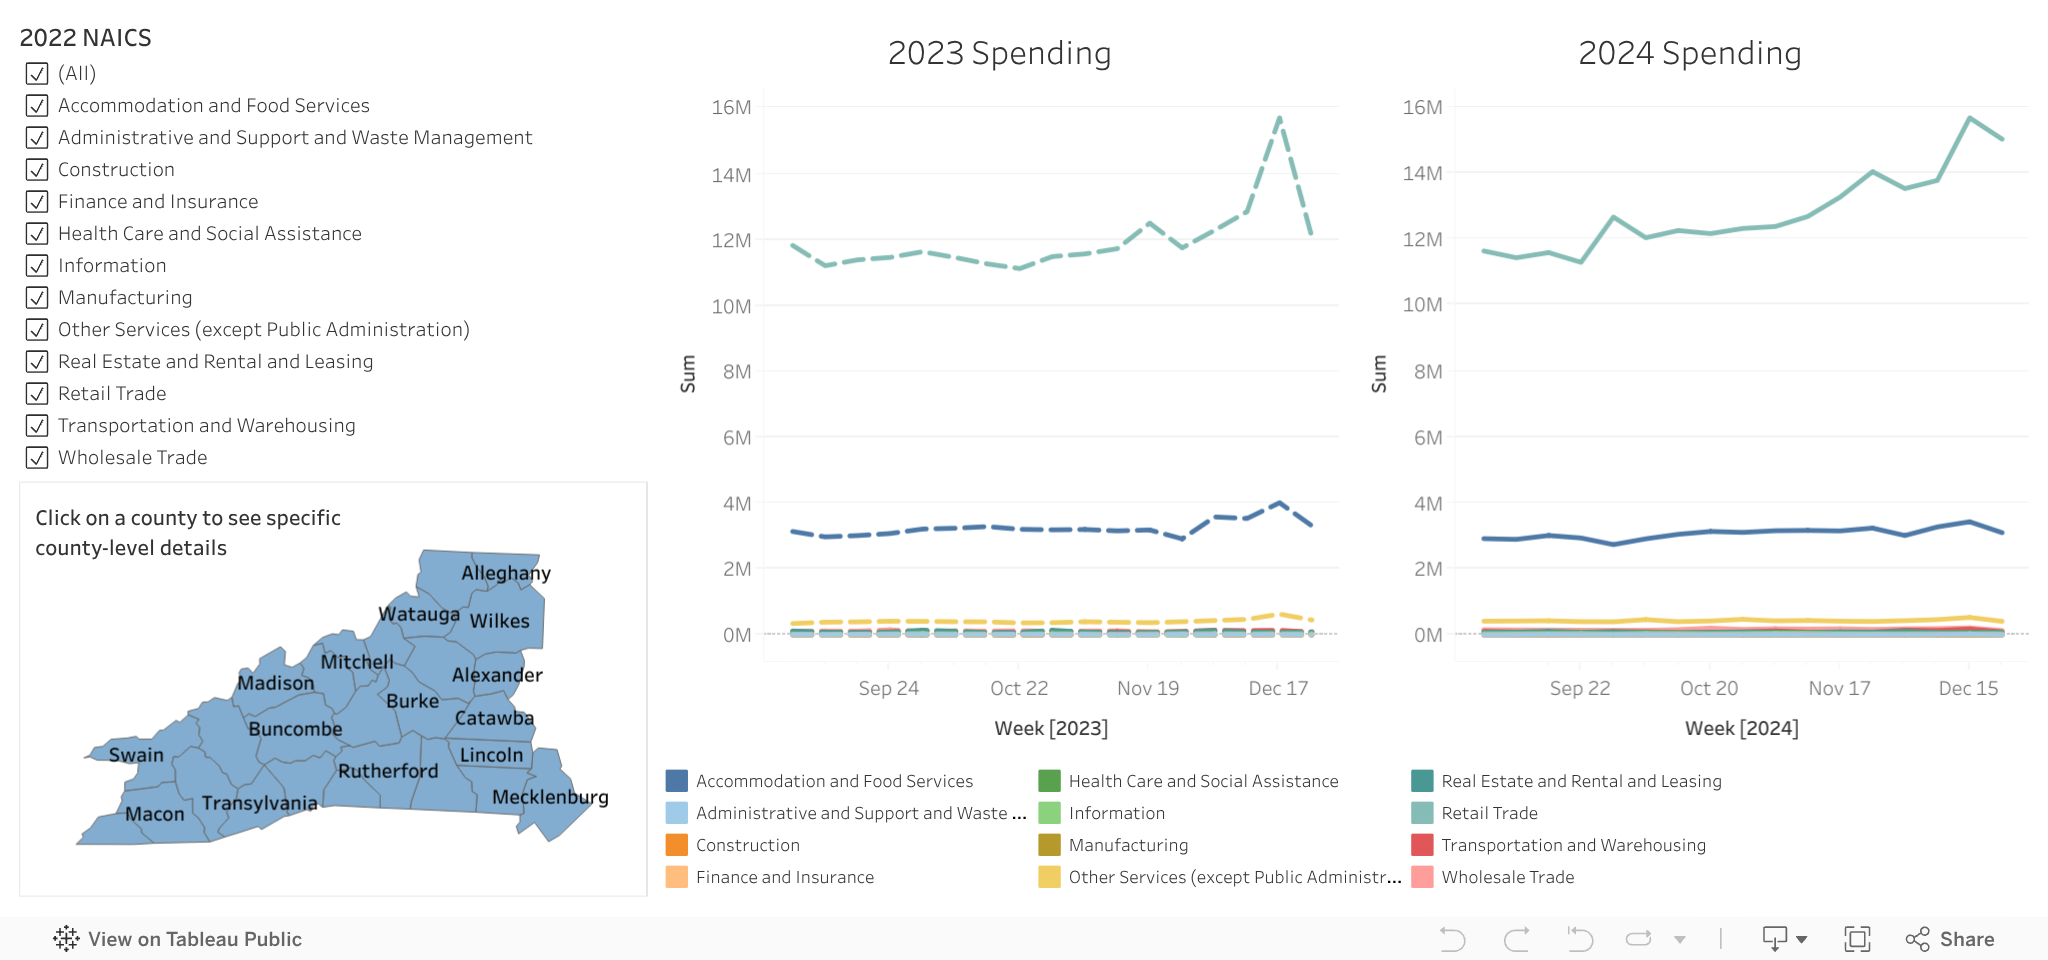
Consumer Spending
Tracking Credit Card Spending Trends
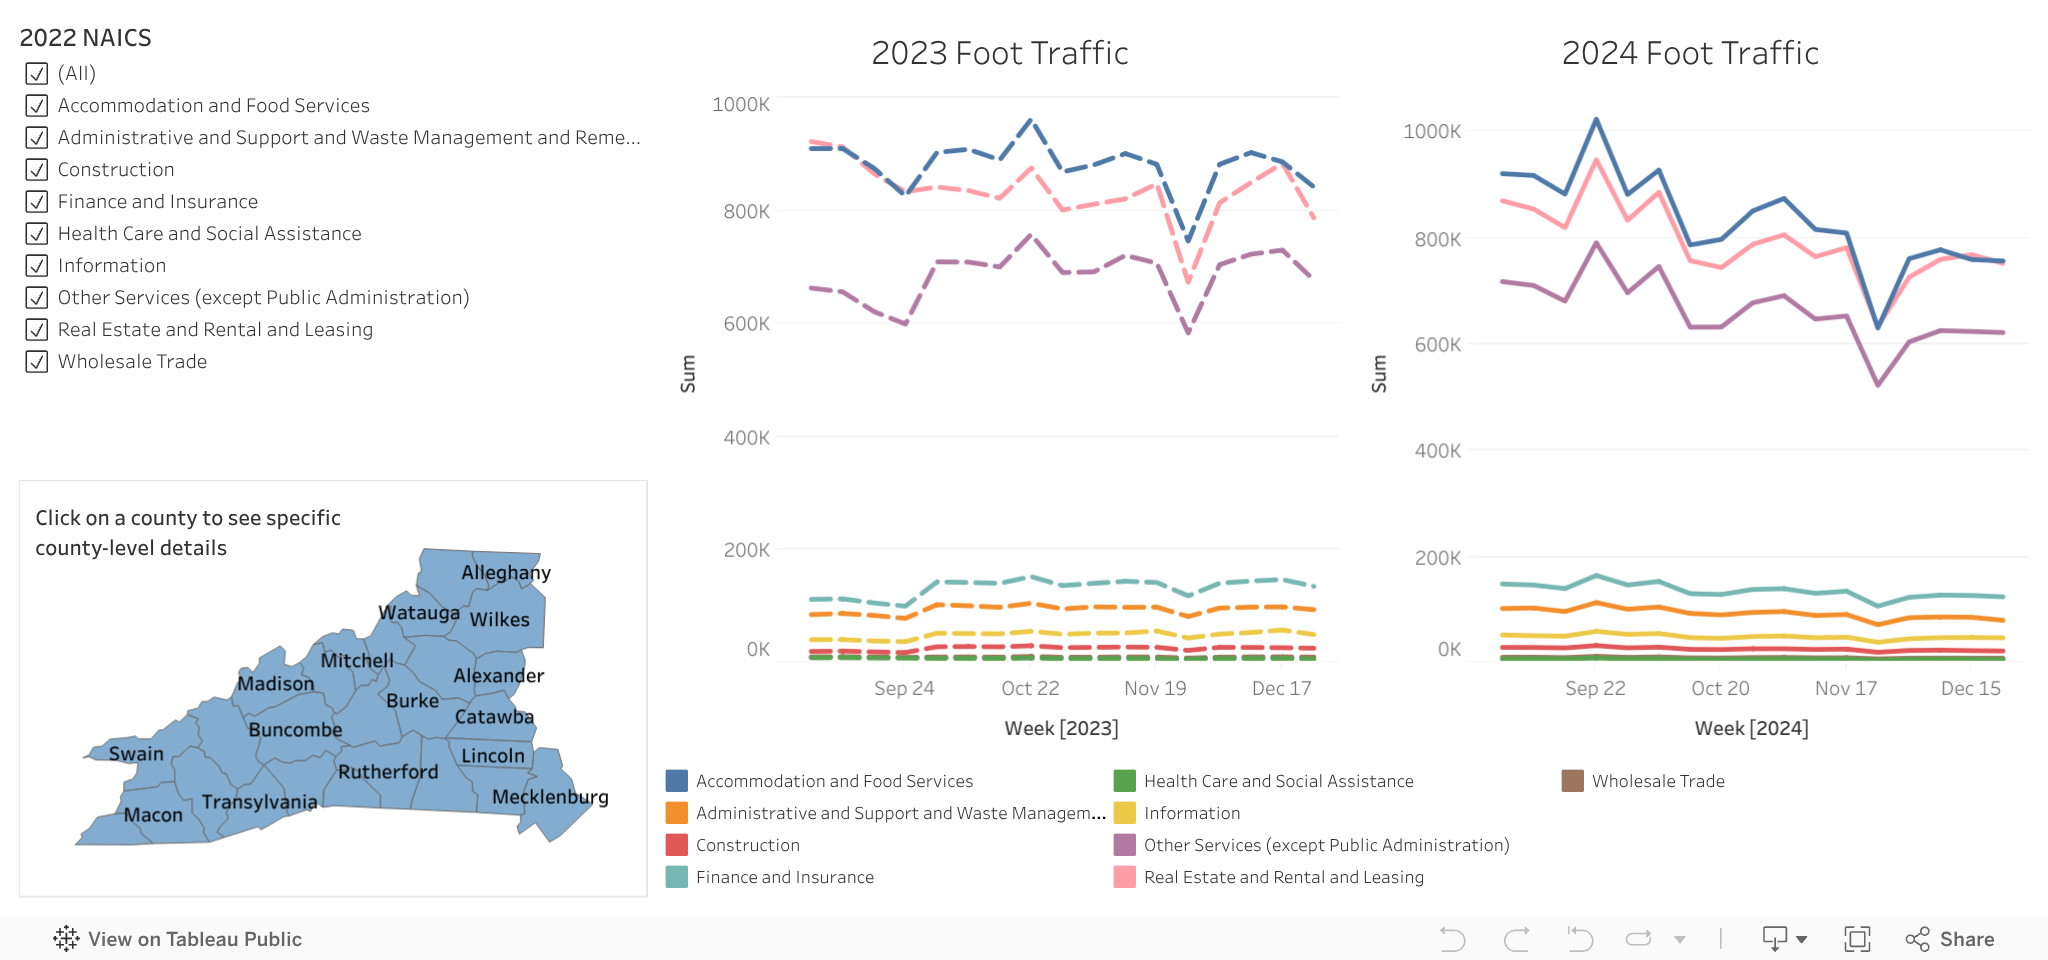
Foot Traffic
Tracking movement through commercial areas
This is a preliminary version of the dashboard and is not intended for distribution.
UPDATED AS OF JANUARY 2025
Please direct feedback and questions to Kenan Institute Assistant Director of Business Development Shannon Chen (shannon_chen@kenan-flagler.unc.edu).