


In recent years, North Carolina has emerged as one of the nation’s strongest state economies, consistently ranking at or near the top in gross domestic product growth,1 population growth2 and strength of overall business climate.3 The state’s economy grew 6.6% in 2021, surpassing the national growth rate of 5.8%.1 This momentum carried into the post-pandemic recovery, with state GDP rising 3.3% in 2024, compared with 2.8% nationally.1
A central ingredient in this performance is the state’s expanding working‑age population. North Carolina has ranked in the top three nationally for population growth since 2022, behind only Texas and Florida,2 attracting both domestic and foreign‑born workers across a wide range of skill levels. Foreign‑born labor accounted for roughly 12% of the state’s total labor force in 2024, below the national share of 19%,4 but represented a meaningful portion of employment in key sectors including construction (37%), manufacturing (18%), and leisure and hospitality (20%) (Figure 1). Other industries, such as agriculture, also employ a substantial foreign-born workforce, but this analysis focuses on populous metropolitan areas, where agriculture accounts for only a minimal share of employment and GDP.
Figure 1: Percent of Total Workers in North Carolina Who Are Foreign-Born, By Industry (2024)
Alt Text: Horizontal bar chart titled “Percent of Total Workers in North Carolina Who Are Foreign-Born, By Industry (2024).” The chart ranks industries by the share of workers who are foreign-born with. Blue bars highlight that Construction, Leisure and Hospitality, and Manufacturing are the sectors with the highest share of foreign-born workers in North Carolina. Source: NC Commerce.
Because foreign‑born workers play a vital role in sustaining the state’s labor supply, recent declines in immigrant labor pose challenges for industries that rely on this segment of the workforce. Early evidence suggests that several immigrant‑dense sectors in many large metro areas are already experiencing tightening labor conditions.5 These pressures raise important questions about how North Carolina can maintain economic momentum in the face of increasingly constrained workforce availability.
The analysis below uses data and the Extended Metropolitan Area framework from our American Growth Project to identify which industries in North Carolina’s largest regional economies are most vulnerable to declines in immigrant labor. Specifically, we focus on the Charlotte, Greensboro, and Raleigh and Durham regions, examining the share of GDP and employment tied to immigrant-intensive industries (Figure 2). By identifying emerging labor shortages, this framework helps guide strategies for supporting employers and sustaining economic output.
Figure 2: EMA Map of NC highlighting Charlotte, Greensboro, Raleigh and Durham EMAs
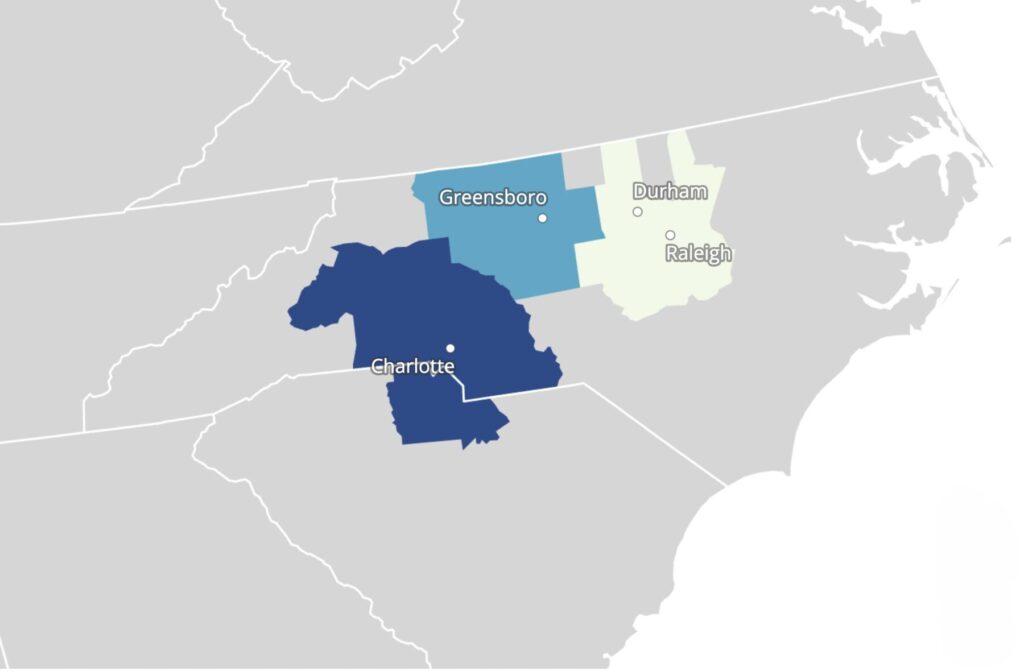
Alt Text: Map of North Carolina highlighting three major metro areas: Charlotte, Greensboro, and the Raleigh–Durham region. City names are labeled near each shaded area, and surrounding state boundaries and roads are shown in light gray for context.
Counties in each EMA:
Greensboro: Alamance, Davidson, Davie, Forsyth, Guilford, Randolph, Rockingham, Stokes, Surry, Yadkin.
Raleigh and Durham: Chatham, Durham, Franklin, Harnett, Johnston, Lee, Orange, Person, Vance, Wake.
Charlotte: NC: Alexander, Anson, Burke, Cabarrus, Caldwell, Catawba, Gaston, Iredell, Lincoln, McDowell, Mecklenburg, Rowan County, Stanly, Union. South Carolina: Chester, Lancaster, York.
The Scale of Immigrant Labor Declines
According to analysis of data from the Current Population Survey (2024), immigrants make up roughly 37% of North Carolina’s construction workforce, 18% of manufacturing workers and 20% of those employed in leisure and hospitality. These concentrations highlight the meaningful role foreign-born labor plays in supporting the state’s economic growth trajectory.
Recent demographic and migration trends, however, point to emerging labor‑supply pressures. After several years of rising inflows, net international migration in North Carolina slowed sharply — from about 83,000 (July 1, 2023, through June 30, 2024) to 47,000 (July 1, 2024, through June 30, 2025).2 Kenan Institute estimates using census data show comparable declines across all three major EMAs (Figure 3). In Charlotte, net migration dropped from 33,676 in mid-2024 to 19,046 in mid-2025; in Raleigh and Durham, it fell from 24,441 to 15,026; and in Greensboro, from 10,909 to 6,236.
This reduction reflects a combination of factors that also appears at the national level, including fewer foreign‑born arrivals, increased voluntary departures and changes in federal immigration policy. As a result, more foreign-born workers are leaving North Carolina, and fewer are opting to relocate to the state. Understanding the scale of this demographic shift, and the sectors most affected by it, is essential for developing resilience strategies and supporting businesses in labor-dependent industries.
Figure 3: Net International Migration for Major Metros in North Carolina
Alt Text: Bar chart titled annual net international migration (persons) for Charlotte, Raleigh and Durham, and Greensboro from 2021 to 2025. Charlotte has the highest values each year, rising from about 4,000 in 2021 to a peak near 34,000 in 2024, then declining to about 19,000 in 2025. Raleigh and Durham follows a similar pattern, increasing from roughly 3,000 in 2021 to around 24,000 in 2024, then falling to about 15,000 in 2025. Greensboro shows the lowest totals, growing from about 1,500 in 2021 to around 11,000 in 2024, then dropping to approximately 6,000 in 2025. All three metros show strong growth through 2024 and a decrease in 2025. Source: Census Bureau
Economic Exposure in Major Metropolitan Areas
Figure 4 illustrates the extent to which North Carolina’s metropolitan areas rely on immigrant‑dense industries by comparing each region’s employment and GDP shares in manufacturing, construction, and leisure and hospitality with national averages. These comparisons highlight differences across major metros: for example, manufacturing accounts for 9.7% of total employment in Charlotte and 12.6% in Greensboro, both above the national share (8.1%).
Within our framework, an EMA is considered more economically exposed when its sectoral employment or GDP share exceeds the corresponding national benchmark. Regions that rely more heavily on these immigrant‑dependent industries face greater vulnerability when the foreign‑born labor supply contracts, as even modest workforce constraints can affect local economic activity.
Figure 4: Economic Exposure of Immigrant-Reliant Industries in Select Metropolitan Areas
| Manufacturing | Construction | Leisure & Hospitality | ||||
| Employment | GDP | Employment | GDP | Employment | GDP | |
| US | 8.1 | 10.1 | 5.2 | 4.4 | 10.7 | 4.4 |
| Charlotte | 9.7 | 9.8 | 5.6 | 4.9 | 11.0 | 3.9 |
| Greensboro | 12.6 | 19.9 | 5.0 | 4.9 | 10.6 | 3.4 |
| Raleigh-Durham | 5.8 | 13.7 | 5.7 | 4.7 | 9.8 | 3.1 |
Alt Text: This table compares the share of employment and GDP across three industries—Manufacturing, Construction, and Leisure & Hospitality—for the United States, Charlotte, Greensboro, and Raleigh-Durham.
Values shown in bold indicate figures above the national average for that industry. In Charlotte, employment share in Manufacturing, employment and GDP shares in Construction, and employment share in Leisure and Hospitality are higher than the national average. In Greensboro, GDP and employment shares in Manufacturing, and GDP share in Construction are higher than the national average. In Raleigh-Durham, GDP share in Manufacturing, and employment and GDP shares in Construction are higher than the national average.
Source: Kenan Institute estimates based on data from BLS and BEA.
Manufacturing
Manufacturing represents a significant source of economic exposure in Charlotte, Greensboro, and Raleigh and Durham. In Charlotte, 9.7% of the workforce is employed in manufacturing, compared with the national average of 8.1%, and foreign‑born workers contribute across the full spectrum of production. Raleigh and Durham shows a different pattern: Manufacturing accounts for a relatively small share of employment (5.8%) but a disproportionately large share of GDP (13.7%), well above the national benchmark of 10.1%. This reflects the region’s concentration in high‑value subsectors such as pharmaceuticals, where economic output depends on a relatively small, highly specialized workforce. In this context, potential constraints are less likely to stem from broad reductions in foreign‑born labor and more from bottlenecks in high‑skill immigration channels that support specialized production.
Greensboro’s manufacturing sector is large by national standards, making it particularly vulnerable to labor supply disruptions. Once a hub for textiles, furniture and automotive production, the Triad experienced steep manufacturing declines in the 2000s. It has since begun to rebuild, repurposing old facilities into centers for aerospace and advanced automotive manufacturing. While publicly available data do not disaggregate the share of foreign-born manufacturing workers in this EMA, American Community Survey data indicates Greensboro’s immigrant population is overwhelmingly of working age (82.7% are 16–64),6 suggesting that immigrants contribute to the sector’s continuing revitalization.
Across these three regions, the loss of foreign‑born labor could disrupt manufacturing processes. Production systems depend on coordinated workflows in which workers contribute not only to final assembly but also to earlier stages of development. Disruptions at any stage of production can delay project timelines and strain supply chains, potentially contributing to cost increases.
Construction
As is the case nationwide, the Tar Heel State’s construction industry is heavily dependent on foreign‑born labor, with over 30% of construction workers born abroad. This holds at the metro level as well: In the Raleigh area, for example, construction has the highest share of foreign‑born workers of any major industry, with more than 27% of its workforce born outside the United States.7
The scale of the construction sector in each EMA underscores the potential economic impact of these workforce shifts. In Charlotte, 5.6% of the workforce is employed in construction — slightly above the national average of 5.2% — and the sector accounts for 4.9% of regional GDP, compared with 4.4% nationally. Raleigh and Durham shows a similar pattern, with construction representing 5.7% of employment and 4.7% of GDP, both slightly above national benchmarks. Greensboro is less exposed on the employment side, but its construction sector still accounts for 4.9% of total GDP, exceeding the national share.
Immigrant labor loss, including the loss of workers without permanent legal status, can disrupt construction activity by interfering with the productivity of the entire team, not just the positions directly vacated.8 Construction relies on interdependent tasks, and the removal of immigrant workers in labor‑intensive stages such as framing or drywall can create bottlenecks for those performing downstream tasks like electrical wiring or plumbing. In this context, foreign-born and native-born workers function as complements rather than substitutes: removing one team member lowers the marginal productivity of the other.8
Leisure and Hospitality
Leisure and hospitality represents a smaller‑than‑average share of employment in Raleigh and Durham as well as Greensboro, while Charlotte sits slightly above the national benchmark of 10.7%, with the sector accounting for roughly 11% of local jobs. Charlotte’s rapid population growth and vibrant business-travel market boost demand for restaurants, hotels and event spaces, and a meaningful reduction in foreign-born labor could strain its hospitality services.
Although leisure and hospitality constitutes a smaller share of GDP than the national average, the sector plays an outsized economic role in several smaller North Carolina EMAs. In the coastal city of Wilmington, it accounts for 15.9% of total employment and 5% of GDP, above the national GDP benchmark of 4.4%. Asheville shows a similar pattern, with 14.2% of employment and 7% of GDP tied to tourism‑driven activity. Further, a study from Luxury Link, a luxury hotel booking platform, found that over a quarter of Asheville’s hotel employees are born outside the US.9
Immigrant labor loss in Wilmington, Asheville and even Charlotte could trigger staffing shortages, affecting both service quality and operating hours. With fewer workers, businesses might struggle to service tables, clean rooms or check in hotel guests. These pressures peak during tourism season: summer in Wilmington and both summer and autumn in Asheville.
Growth Strategies
Long-run policies are essential to addressing persistent labor supply challenges, but short-run strategies can help ease immediate economic strain. Accelerated training programs, developed with input from employers in immigrant-dependent sectors, can equip new workers with essential, job-specific skills. For example, community colleges could partner with local firms to refine fast‑track credential programs in areas such as welding or hospitality.
Productivity‑enhancing technologies can also help firms weather sudden labor shocks. For example, studies of workforce scheduling driven by artificial intelligence indicate that hotels and restaurants can achieve substantial improvements in scheduling efficiency and productivity by using predictive algorithms to align staffing capacity with fluctuating demand.10,11 In manufacturing, advanced technology, such as automated quality‑inspection systems, can free employees for more specialized tasks. For example, manufacturers in the Triad and Charlotte regions have adopted AI‑enabled quality inspection systems, boosting productivity and redistributing labor toward more operations roles.12
Finally, temporary employment programs for immigrant workers and rapid‑response hiring strategies can help fill priority roles more quickly. Temporary, sector‑specific programs for immigrant workers often garner bipartisan support, particularly in periods of heightened demand for less-skilled foreign workers.13 Conservatives may view these programs as a way to meet workforce needs without relaxing border controls, while the center‑left tends to see them as a pragmatic tool for stabilizing labor markets while broader immigration reforms take shape. In the near term, rapid‑response hiring strategies could also ease employer strain. For instance, NCWorks, the state’s job‑matching platform, could be leveraged to support placement efforts in industries affected by recent labor declines.
Conclusion
Reductions in labor supply — whether driven by the loss of foreign-born workers, retirements or caregiving‑related exits from the workforce — can place significant strain on labor-dependent industries. As labor constraints tighten, the effects can ripple through production and service delivery, increasing the risk of bottlenecks and service quality deterioration. The drop in net international migration in 2025 heightened these concerns for immigrant-intensive industries such as manufacturing, construction, and leisure and hospitality.
Comparing employment and GDP shares across North Carolina’s most populous EMAs to national benchmarks reveals that each is overexposed in manufacturing and construction relative to the US as a whole, while Charlotte is also overexposed in leisure and hospitality employment. Tourism‑oriented metros, such as Wilmington and Asheville, exhibit an even greater exposure in leisure and hospitality, making them particularly vulnerable to immigrant labor loss.
This report proposes near-term growth strategies that can mitigate immediate labor gaps linked to reduced migration. These strategies include accelerated training programs to prepare native‑born workers for high‑demand roles, temporary and targeted employment programs, and rapid‑response hiring mechanisms. In some contexts, automation and AI can be applied to routine tasks, allowing workers to shift to higher-value activities. Taken together, these near‑term strategies could provide a stopgap for emerging labor shortages in immigrant-dependent industries, supporting continued economic growth across the state.
1 GDP by State. U.S. Bureau of Economic Analysis (2026).
2 Annual Estimates of the Resident Population Change for the United States, Regions, States, and Puerto Rico. U.S. Census Bureau (2025).
3 Cohn, S. North Carolina is America’s Top State for Business in 2025, led by a strong workforce and economy. CNBC https://www.cnbc.com/2025/07/10/north-carolina-top-state-for-business-america.html (2005).
4 Foreign-Born ACS Data Tables. U.S. Census Bureau (2025).
5 Wilson, D. & Zhou, X. Unauthorized Immigration Effects on Local Labor Markets. https://www.frbsf.org/research-and-insights/publications/economic-letter/2026/02/unauthorized-immigration-effects-on-local-labor-markets/(2026).
6 B05006: Place of Birth for the Foreign-born Population in the United States – Census Bureau Table. U.S. Census Bureau (2026).
7 Eanes, Z., Fitzpatrick, A. & Beheraj, K. The Local Industries Most Reliant on Foreign-Born Workers. https://www.axios.com/local/raleigh/2025/08/13/the-local-industries-most-reliant-on-foreign-born-workers (2025).
8 Howard, T., Wang, M. & Zhang, D. How Do Labor Shortages Affect Residential Construction and Housing Affordability? SSRN Electron. J. https://doi.org/10.2139/ssrn.4729511 (2024) doi:10.2139/ssrn.4729511.
9 Study: 26.4% of Asheville hotel employees are foreign-born. https://mountainx.com/blogwire/study-26-4-of-asheville-hotel-employees-are-foreign-born/ .
10 Amar, J., Rahimi, S., von Bismarck, N. & Wunnava, A. Workforce Optimization: Staff Scheduling with AI. https://www.mckinsey.com/capabilities/operations/our-insights/smart-scheduling-how-to-solve-workforce-planning-challenges-with-ai (2022).
11 Mehta Shukla, N. The AI-Driven Workforce Is Here. How Should Your Industry Transform? https://www.weforum.org/stories/2026/02/workforce-transformation-ai-jobs/ (2026).
12 Computer Vision for Quality Control: How NC Manufacturers Reduce Defects | Preferred Data Blog.https://www.preferreddata.com/blog/computer-vision-quality-control-manufacturers-north-carolina-2026 (2026).
13 Orrenius, P. M. & Zavodny, M. Help Wanted: Employer Demand for Less-Skilled Temporary Foreign Worker Visas in an Era of Declining Unauthorized Immigration. RSF Russell Sage Found. J. Soc. Sci. 6, 45–67 (2020).