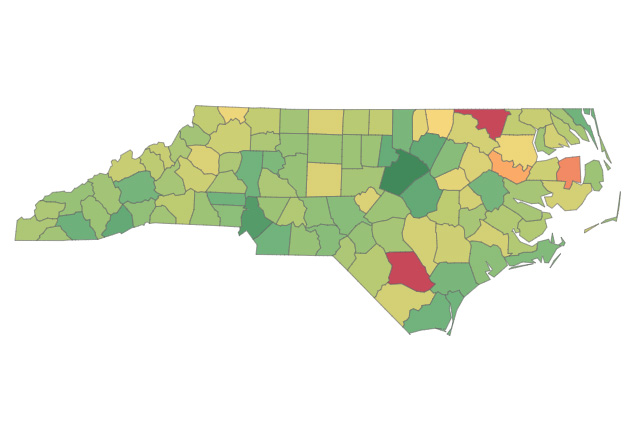
County GDP Map
This map visualizes GDP growth rates for all 100 North Carolina counties. The buttons above the map provide options to view a one-year GDP growth rate and rank or to see how these metrics have changed over a five- or 10-year period.
The menu allows you to choose a reference year and view either single-year GDP growth or the growth trajectories for five- and 10-year periods ending in the year of your choosing – i.e., if you choose “10-Year Growth” and 2024 as the “Year,” you will see the annualized GDP growth for the years 2014 through 2024.

Data provided by the Bureau of Economic Analysis, the U.S. Census Bureau, and the Bureau of Labor Statistics.
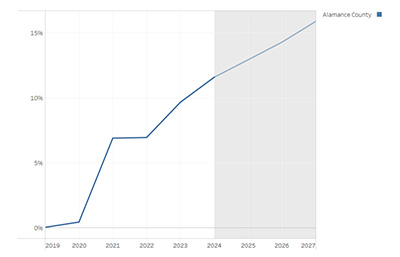
GDP Percent Change from 2019
This chart shows the percentage change in GDP for North Carolina counties, using 2019 as a baseline year. By using the pull-down menu, you can select multiple counties to compare their GDP growth trajectories including forecasts through the year 2027.
Shaded values represent estimates of GDP percent change for 2025– 2027. The 2025 estimate is a Kenan Institute nowcast using higher frequency data sources, while 2026–2027 are Kenan Institute forecasts.

Data provided by the Bureau of Economic Analysis, the U.S. Census Bureau, and the Bureau of Labor Statistics.
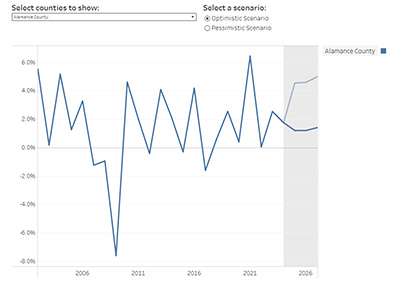
GDP Scenarios
This chart shows annual GDP growth for North Carolina counties from 2002 through 2027. Using the pull-down menu on the left, you can select multiple counties to compare year-over-year growth. The pulldown menu on the right lets you view two alternative forecast paths: an Optimistic Scenario, which reflects the upper range of likely outcomes, and a Pessimistic Scenario, which reflects the lower range. These scenarios are derived from the 90% confidence interval around each forecast.
Shaded values represent estimates for 2025– 2027. The 2025 estimate is a Kenan Institute nowcast using higher frequency data sources, while 2026–2027 are Kenan Institute forecasts.

Data provided by the Bureau of Economic Analysis, the U.S. Census Bureau, and the Bureau of Labor Statistics.
County GDP Map
GDP Percent Change from 2019
GDP Scenarios