


In January and February of this year, we released estimates for Extended Metro Area (EMA) economic growth in 2023. At that time, national economic activity was expected to grow, albeit slowly, for the year, with the economy falling into recession in late 2023/early 2024. Given this outlook, we anticipated that less than half of our EMAs would contract in 2023.[1] The economy has held up better than expected, though we still anticipate a recession sometime over the next year. As a result, our latest estimates now project that just three of our 150 EMAs will shrink in 2023 – Beaumont, TX; Lafayette, LA and Allentown, PA – and all three of them are forecast to have GDP decline by just a few tenths of a percent. Allentown is also one of only two EMAs to have a growth downgrade, the other being Midland, TX (although both downgrades are relatively small). Even with a slight downward revision, Midland remains the EMA with the highest projected growth (at 6.0%), while Allentown’s estimated 0.4% contraction is the lowest in our estimates. When looking solely at large cities (defined as the top 50 largest EMAs), Austin, TX overtakes San Francisco, CA as our fastest grower; none of our large EMAs are expected to fall in 2023 (the map below illustrates the projected GDP growth for all 150 EMAs in 2023).
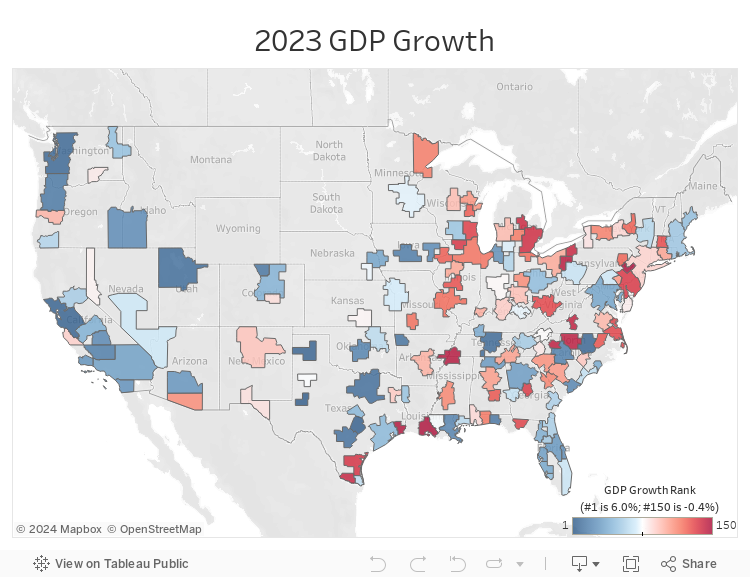
Challenges in Measuring Regional Economic Activity
Measurement of U.S. regional economic trends is frequently lacking in three key aspects. First, when these subnational economies are examined, current methods of analysis often divide the country in ways that fail to accurately capture existing economic ties. Our own native region of Raleigh, Durham, and Chapel Hill, NC illustrates this point. While the three cities are highly economically intertwined –and are even collectively referred to as the “Research Triangle” – they are disaggregated into multiple entities by the U.S. Census. Analyzing these cities separately thus fails to capture the extent to which these cities operate as one connected microeconomy. Second, the annualized timeframe by which local economic activity is reported can lead to analysis based on stale data. As an example, the latest measure of county or metro-level GDP covers 2021 but wasn’t released until December 2022, meaning that discussions based on this data miss 18 months of activity that has already taken place. Finally, commonly used measurements for growth, such as Gross Domestic Product (GDP), calculate only economic output, glossing over equally relevant questions of distribution and sustainability.
To solve these problems and facilitate a more accurate discussion of the U.S. economy, the Kenan Institute of Private Enterprise has undertaken the American Growth Project. Broadly, the project seeks to provide more granular, expansive, and current data on regional economies within the United States, as well as a thorough analysis of the results. We’re interested in taking a magnifying lens to the multiple interconnected economic spheres in the U.S. to better understand who’s growing, who isn’t, how this growth can be broken down, the trends that have driven this growth until now, and what these regions might be able to expect in future.
To that end, we have created Extended Metropolitan Areas (EMAs), which represent U.S. urban areas connected in economically meaningful ways; our current analysis examines the 150 largest EMAs by population. The EMAs are generally aggregated from county-level data, which is the deepest level at which most economic data is reported. The size and characteristics of EMAs can range widely – the EMA around New York City contains more than 24 million people, comprises four states and produces more than $2 trillion of economic activity; by contrast, the smallest EMA, Wilmington, NC contains less than 300,000 people. This variety, in and of itself, demonstrates the breadth of unique economic ecosystems that exist under one national umbrella. While our 150 EMAs don’t capture the complete national economic picture, they get pretty close, as they represent 84% of the U.S. population and 88% of national GDP. Future research endeavors to complete the puzzle and – as our last Insight on skills illustrates – analyze the drivers of this growth.
Updating and Upgrading Our Forecasts
Our modelling efforts allow us to incorporate data from our regional economies – such as job creation and housing activity – from 2022 and the first half of 2023. After using the historical data to build estimates of 2022, we integrate data from the year to date into our forecasts to build a projection for the full year.[2] Thus far, the numbers for 2023 – particularly labor market metrics – have come in meaningfully stronger than expected. While job growth has slowed from its recent highs, it still remains quite strong, as illustrated by the 1.7 million jobs created nationally in the six months ending in June 2023 versus 2.1 million in the prior six months. (To put this into perspective, based on labor force dynamics job growth during the first half of the year should be roughly 600,000.) Though our models still expect the economy will experience even slower growth ahead, our updated forecast is now much stronger than our predictions at the beginning of the year.
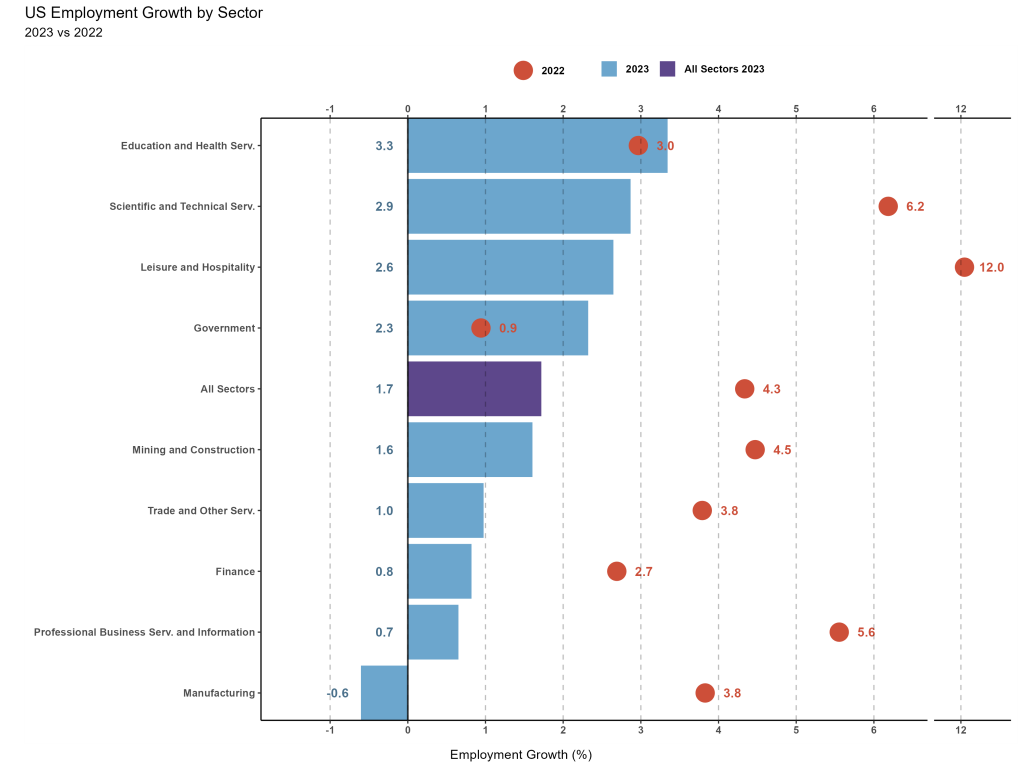
The biggest surprise has been the strength of tech-related hiring. Despite weakening company fundamentals and numerous large-scale layoffs, tech jobs are still in demand by employers both within and outside the traditional tech sector – and have had the largest forecast upgrade.[3] This has particularly benefitted places like Austin, which has also been helped by migration from the Bay Area. In fact, over the last twelve months the share of employment in the tech sector increased meaningfully in Austin while the share in San Francisco edged down. The figure below shows employment changes by industry in 2022 (the orange circles) as well as our latest industry projections for 2023 (the blue bars).
Employment in the mining and construction sectors has also had significant upgrades, benefitting Cape Coral-Fort Myers, FL (which also includes Naples). Cape Coral-Fort Myers moved up from the 80th to 23rd fastest growing mid-sized EMA (the map below includes all EMAs, where it is in 45th place up from 118th). Other EMAs in the state, such as North Port-Sarasota, and Tampa, also notched big gains. It is not particularly surprising that our projections for that region should change so substantially. The uncertain economic fallout from last fall’s Hurricane Ian posed particular problems for our modelling efforts (Tampa being a notable exception, as it avoided much of the hurricane’s direct impact).[4]
This area has also benefitted from faster than anticipated activity in leisure and hospitality – another sector where we felt our models may be less accurate due to the volatility of post-lockdown travel demand.[5] The strength in tourism has particularly benefited Las Vegas, NV and Myrtle Beach, SC, the two cities where that sector represents over 20% of employment. As a result, Las Vegas’ projected growth increased by 2 percentage points – the largest increase of our 50 largest cities. (The next largest were Tampa, which saw a projected growth increase of 1.6 percentage points, while Myrtle Beach, one of our mid-sized EMAs, had a 1.3 percentage point upgrade).
In sum, the outlook for 2023 looks much better than it did six months ago, thanks to continued healthy job growth, strong household balance sheets, and supply-constrained housing markets in many high growth EMAs. While the gap between the outperformers and underperformers narrowed slightly – and almost all our EMAs had growth upgrades – the disparity still remains very large. Our forecast revisions and the high dispersion illustrates both challenges and opportunities for the American Growth Project. We are constantly working to enhance our models and gather more data to better understand the underlying drivers of regional economic activity.[6] These enhancements will enable us to improve our estimates, provide more detailed information to business and policy makers, and facilitate an understanding of the drivers behind equitable and sustainable growth.
[1] For a discussion why, see https://kenaninstitute.unc.edu/wp-content/uploads/2023/01/american-growth-project-january-01042023r.pdf
[2] For more details see the Methodology section in https://kenaninstitute.unc.edu/wp-content/uploads/2022/10/american-growth-project-10172022r.pdf
[3] Our Workforce Disrupted Grand Challenge is exploring the widening demand for tech jobs.
[4] See endnote 3 in https://kenaninstitute.unc.edu/wp-content/uploads/2023/02/american-growth-project-midsize-cities-02212023r.pdf
[5] See Industry-Level Trends in https://kenaninstitute.unc.edu/wp-content/uploads/2023/01/american-growth-project-january-01042023r.pdf
[6] If you are interested in partnering with us, please contact me at [email protected].