- The spread between 10-year and 3-month Treasurys – my favorite economic indicator – remains strongly in positive territory, suggesting a recession is not in the cards soon.
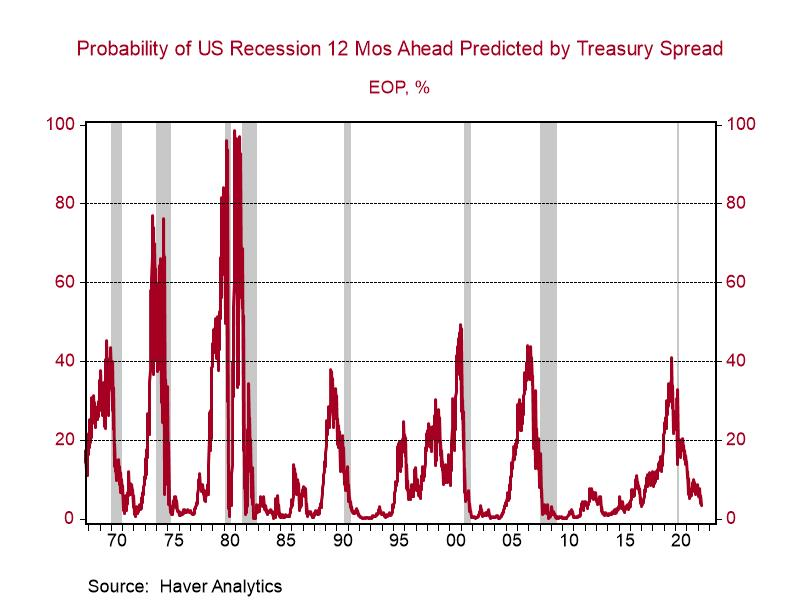
- This indicator has predicted all recessions since the mid-1960s, with a lead time of roughly one year, though the timing is inexact.
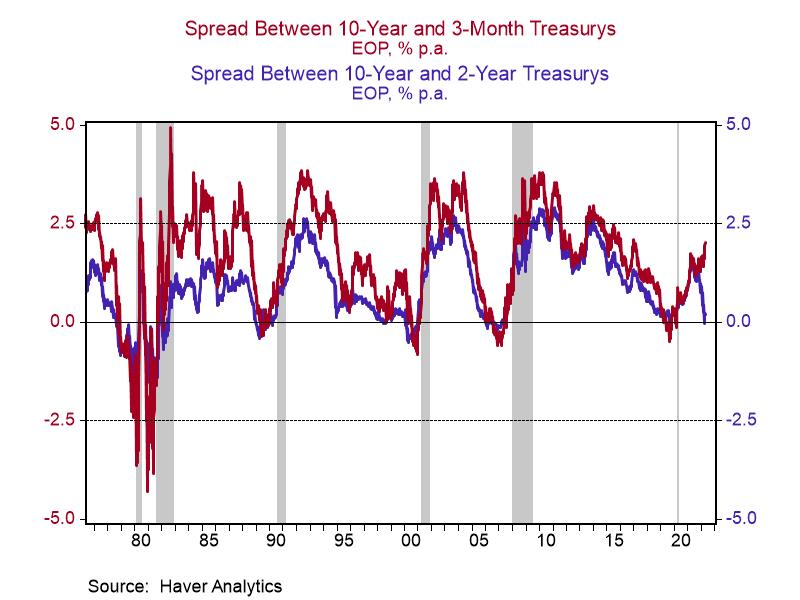
- The 10-year/2-year spread, which briefly inverted recently, is less reliable.
If I were stuck on a deserted island and asked to forecast the U.S. economy based on a note sent in a bottle, I would choose the spread between 10-year Treasury notes and 3-month Treasury bills. As you can see in the graph below, when that spread turns negative, or in bond market parlance the yield curve inverts, a recession has been forthcoming (gray areas represent recessions in the graph). The intuition behind this indicator is that the bond market traders are very attuned to forecasts of economic growth and inflation. When they expect growth or inflation to accelerate, long-term interest rates will rise. Long-term interest rates may also increase because traders see the Fed hiking short-term interest rates. At some point, however, the Fed may overdo it – i.e., it raises rates so much that market participants expect economic growth to slow, or a negative shock hits the economy – and then long-term interest rates will start to fall relative to short-term interest rates. In other words, it’s important to look at not just the movement of long-term interest rates but also what they are doing relative to short-term interest rates.1
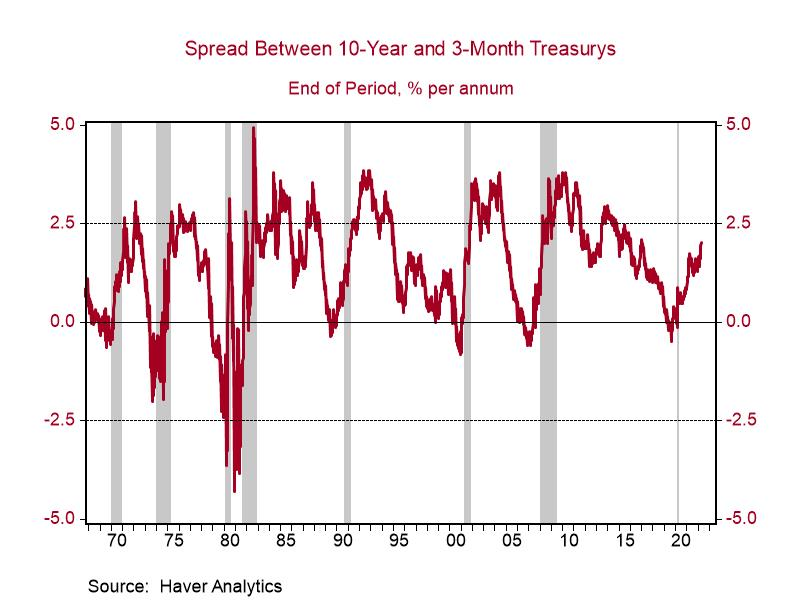
Putting the two pieces together, when the spread between 10-year and 3-month Treasurys widens, economic growth is expected to accelerate; when the spread narrows, activity is expected to slow. When the spread turns negative, market participants anticipate current GDP growth to meaningfully exceed future GDP growth, which is a sign of a recession. The current slope of the 10-year/3-month yield curve is well in positive territory and in recent days has widened further, suggesting a low and falling probability of a recession. A New York Fed model based on the 10-year/3-month spread estimates the probability of a recession over the next year at just 3.5%.
When the spread turns negative, or the yield curve yield inverts, economic prognosticators will often cite special factors driving that inversion and thus minimize the recession signal. Though I had been a fan of the 10-year/3-month spread since the early 1990s, I failed to heed its signal in 2000 and 2006, citing strong demand for long-dated Treasury securities as the driver of the inversion.2 After those lessons learned when the yield curve inverted in 2019, I penciled in a recession, even though others argued that demographics and risk-return-driven demand meant long-term yields were pinned down. Surely the bond market didn’t predict COVID-19, so perhaps its recession forecast was spurious. However, I would argue that the bond market believed the Fed had raised rates enough to choke off growth. In fact, in response to concerns about the economy, the Fed started cutting interest rates in the summer of 2019.
Many market participants recently focused on the spread between 10-year and 2-year Treasurys, which turned negative two weeks ago. As the graph below illustrates, though both spreads tend to move in tandem, the 10-year/2-year spread (depicted in blue) tends to invert more frequently and less decisively than the 10-year/3-month spread (red). This is exactly what has happened recently: The 10-year/2-year spread was negative for a week or so and has now moved back into positive territory. Flirtations such as these are one reason why research indicates that 10-year/2-year is inferior to other yield curve measures.3 Still, the divergence between these two spreads is quite notable, though there have been other periods, such as the mid-1990s, when these measures moved in opposite directions. Some argue that because 2-year Treasurys are predicting Fed actions, the 2-year is a stronger anchor than 3-month Treasurys. Thus, if the Fed meets the market’s expectations, the 10-year/3-month curve will flatten to the 10-year/2-year level. Those forecasts of the Fed may not be realized, however, or as illustrated last week, long-term interest rates could move meaningfully in response to shifts in expectations of the Fed or economic activity.
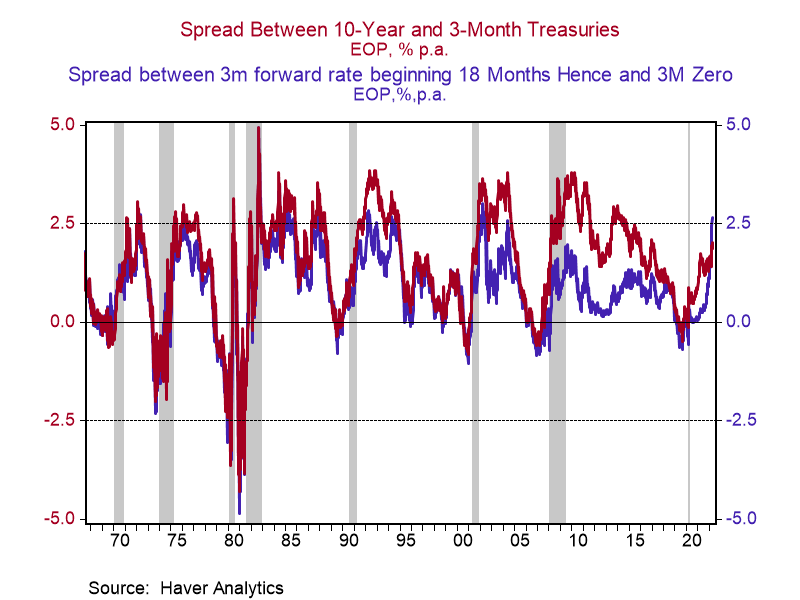
Recently, a new predictive spread has come on the scene. Dubbed the “near-term forward spread” by its Federal Reserve Board creators, it compares the 3-month interest rate 18 months from now implied by the Treasury market with the current 3-month Treasury bill.4 This spread (blue line in the graph below), which has been endorsed by Fed Chair Jerome Powell, has widened even more than the 10-year/3-month spread (red), suggesting an even lower probability of a recession. A model based on the underlying research estimates the current probability of recession over the next year is just 0.01%. As the graph below illustrates, the near-term and 10-3 spreads generally move in tandem, though the near-term spread inverted briefly twice in the mid-1990s, while the 10-3 remained in positive territory. Thus, it is not clear to me that the near-term forward spread is a superior indicator to the 10-3 spread.
Predicting the likelihood of a recession over the next year is fairly easy if you have the spread between 10-year and 3-month Treasurys. Predicting where that spread goes, however, is another matter; forecasting financial markets is an extremely difficult endeavor. That’s why I will continue to monitor the 10-year/3-month spread closely and alert you if it looks like it’s about to turn negative.
1 For more information on the drivers of the relationship see https://www.newyorkfed.org/medialibrary/media/research/current_issues/ci12-5.pdf
2 In 2000 the Treasury stopped issuing 30-year bonds, thus increasing demand for 10-year notes, which because of the inverse relationship between bond prices and yields, lowers interest rates. In 2006, the argument was the global savings glut was driving rates lower.
This Reliable Economic Indicator Is Still Flashing Green