


Governors across the United States have reacted in various ways to the COVID-19 pandemic. In these difficult times, it is instructive to consult The Federalist Papers, which discuss the division of responsibilities between state and federal governments for what Founding Father James Madison argues is the happiness of citizens. Federalist Paper Number 45 argues that state governments are closer to the people and therefore can best focus on their welfare, regulating ordinary affairs such as the lives, liberties, and properties of the people, as well as the internal order of each state. Madison notes that “The operations of the federal government will be most extensive and important in times of war and danger; those of the state governments, in times of peace and security.” In the absence of an early and orchestrated federal response, states, both governors and their legislatures, have been active in their response to COVID-19.
While it is too early to see the long-term effects of this crisis, we can begin to note and analyze the current response of states in order to inform policy decisions going forward. In evaluating state-level responses to the COVID-19 crisis, we recorded governors’ executive actions related to the pandemic’s economic impact. These actions fell into nine categories: business assistance, family assistance, health access, housing, medical response, supply access, task force formation (on both the regional and state level), unemployment and utilities.1
Overall, from March 6 to May 11, 2020, we documented 785 executive actions within 50 states. Medical responses constitute by far the largest category of executive actions, making up roughly 44 percent of total actions, regardless of gubernatorial political affiliation. Business assistance, the second highest executive action category, constitutes roughly 15 percent of all executive actions, while health access makes up 7.4 percent of the total. While some action on the state level has been taken to improve access to medical supplies, this category has not been significantly covered by executive action. There have been 265 executive actions (33 percent of the total) aimed at the social safety net, which, in addition to health access, includes family assistance (11.7 percent), unemployment (7.3 percent) and utilities (2.4 percent). Forty executive actions (5 percent) are classified as pertaining to economic recovery task forces, with 21 regional task force actions and 19 individual state task force actions also taken.
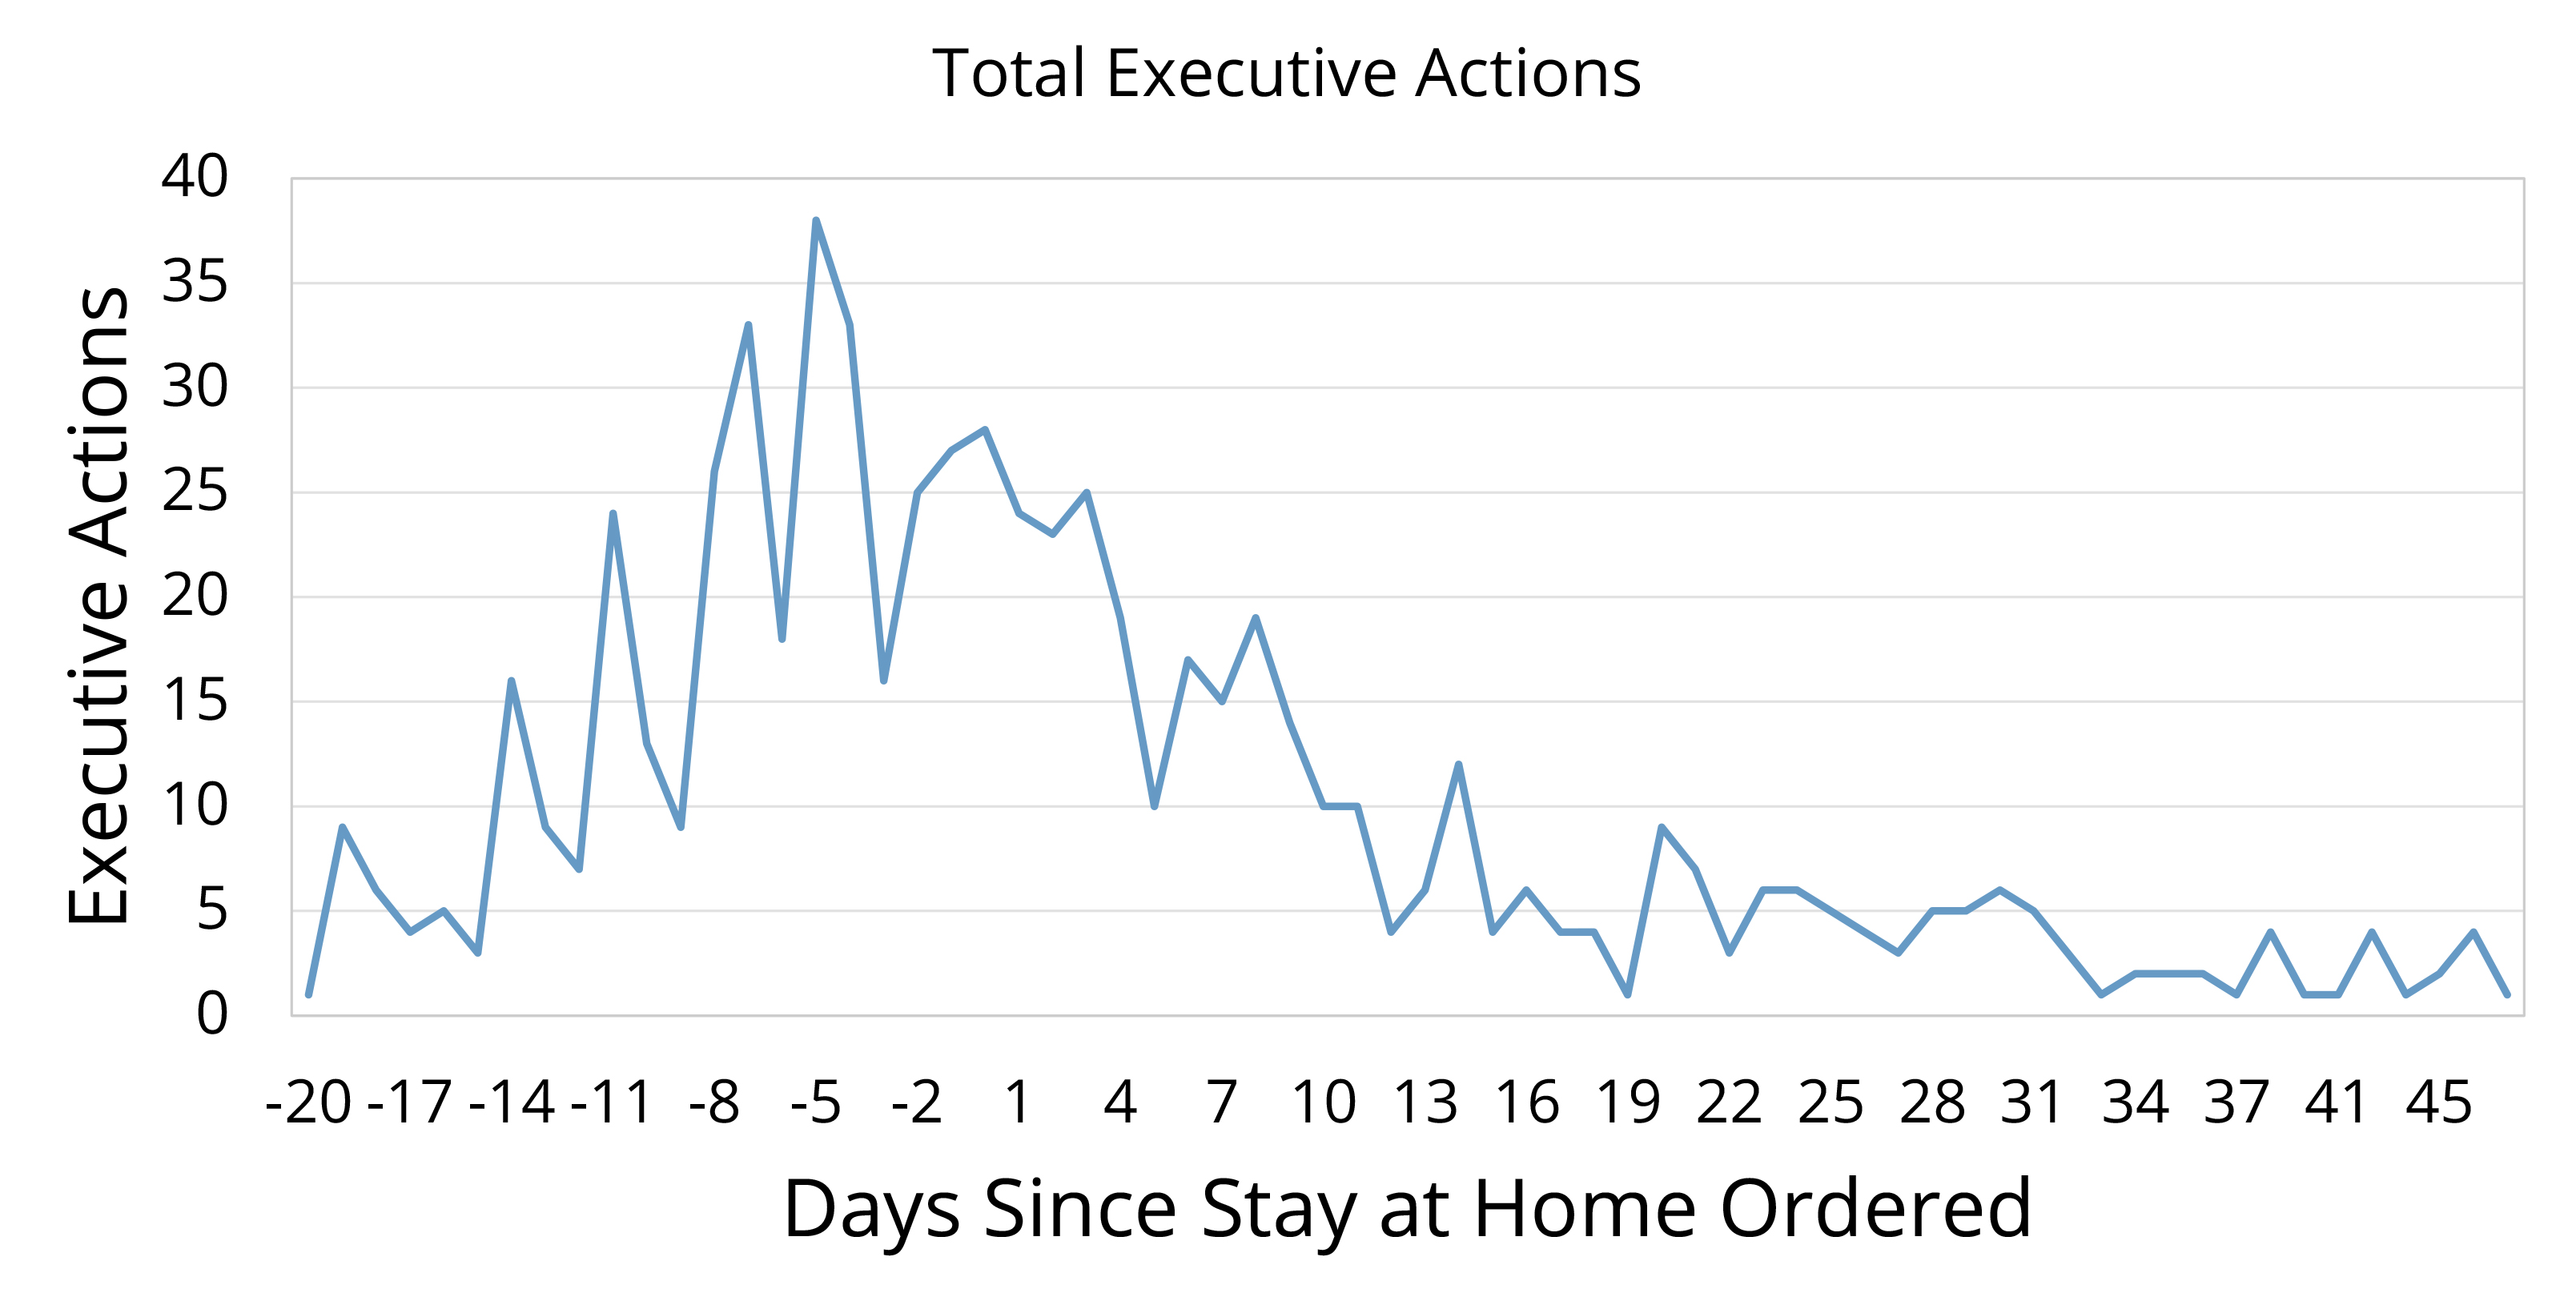
As seen in FIGURE 1, the total number of executive actions taken in states across the nation peaked before the state issued a stay-at-home order, indicating that governors may have used such orders as a last resort to combat COVID-19 in their states.
Evaluating governors’ actions through a partisan lens does not provide much additional insight into state-level responses. States with Democratic governors were more likely to take executive action in most categories. Republican-led states were more likely to have state-level economic recovery task forces, while Democrat-led states were more likely to join a regional task force.2 Party affiliation does seem to play a slight role in the issuance of stay-at-home orders. While all Democratic-led states issued stay-at-home orders, only 18 of the 26 Republican-led states issued these orders. In addition, Democratic governors tended to issue stay-at-home orders sooner than their Republican counterparts.
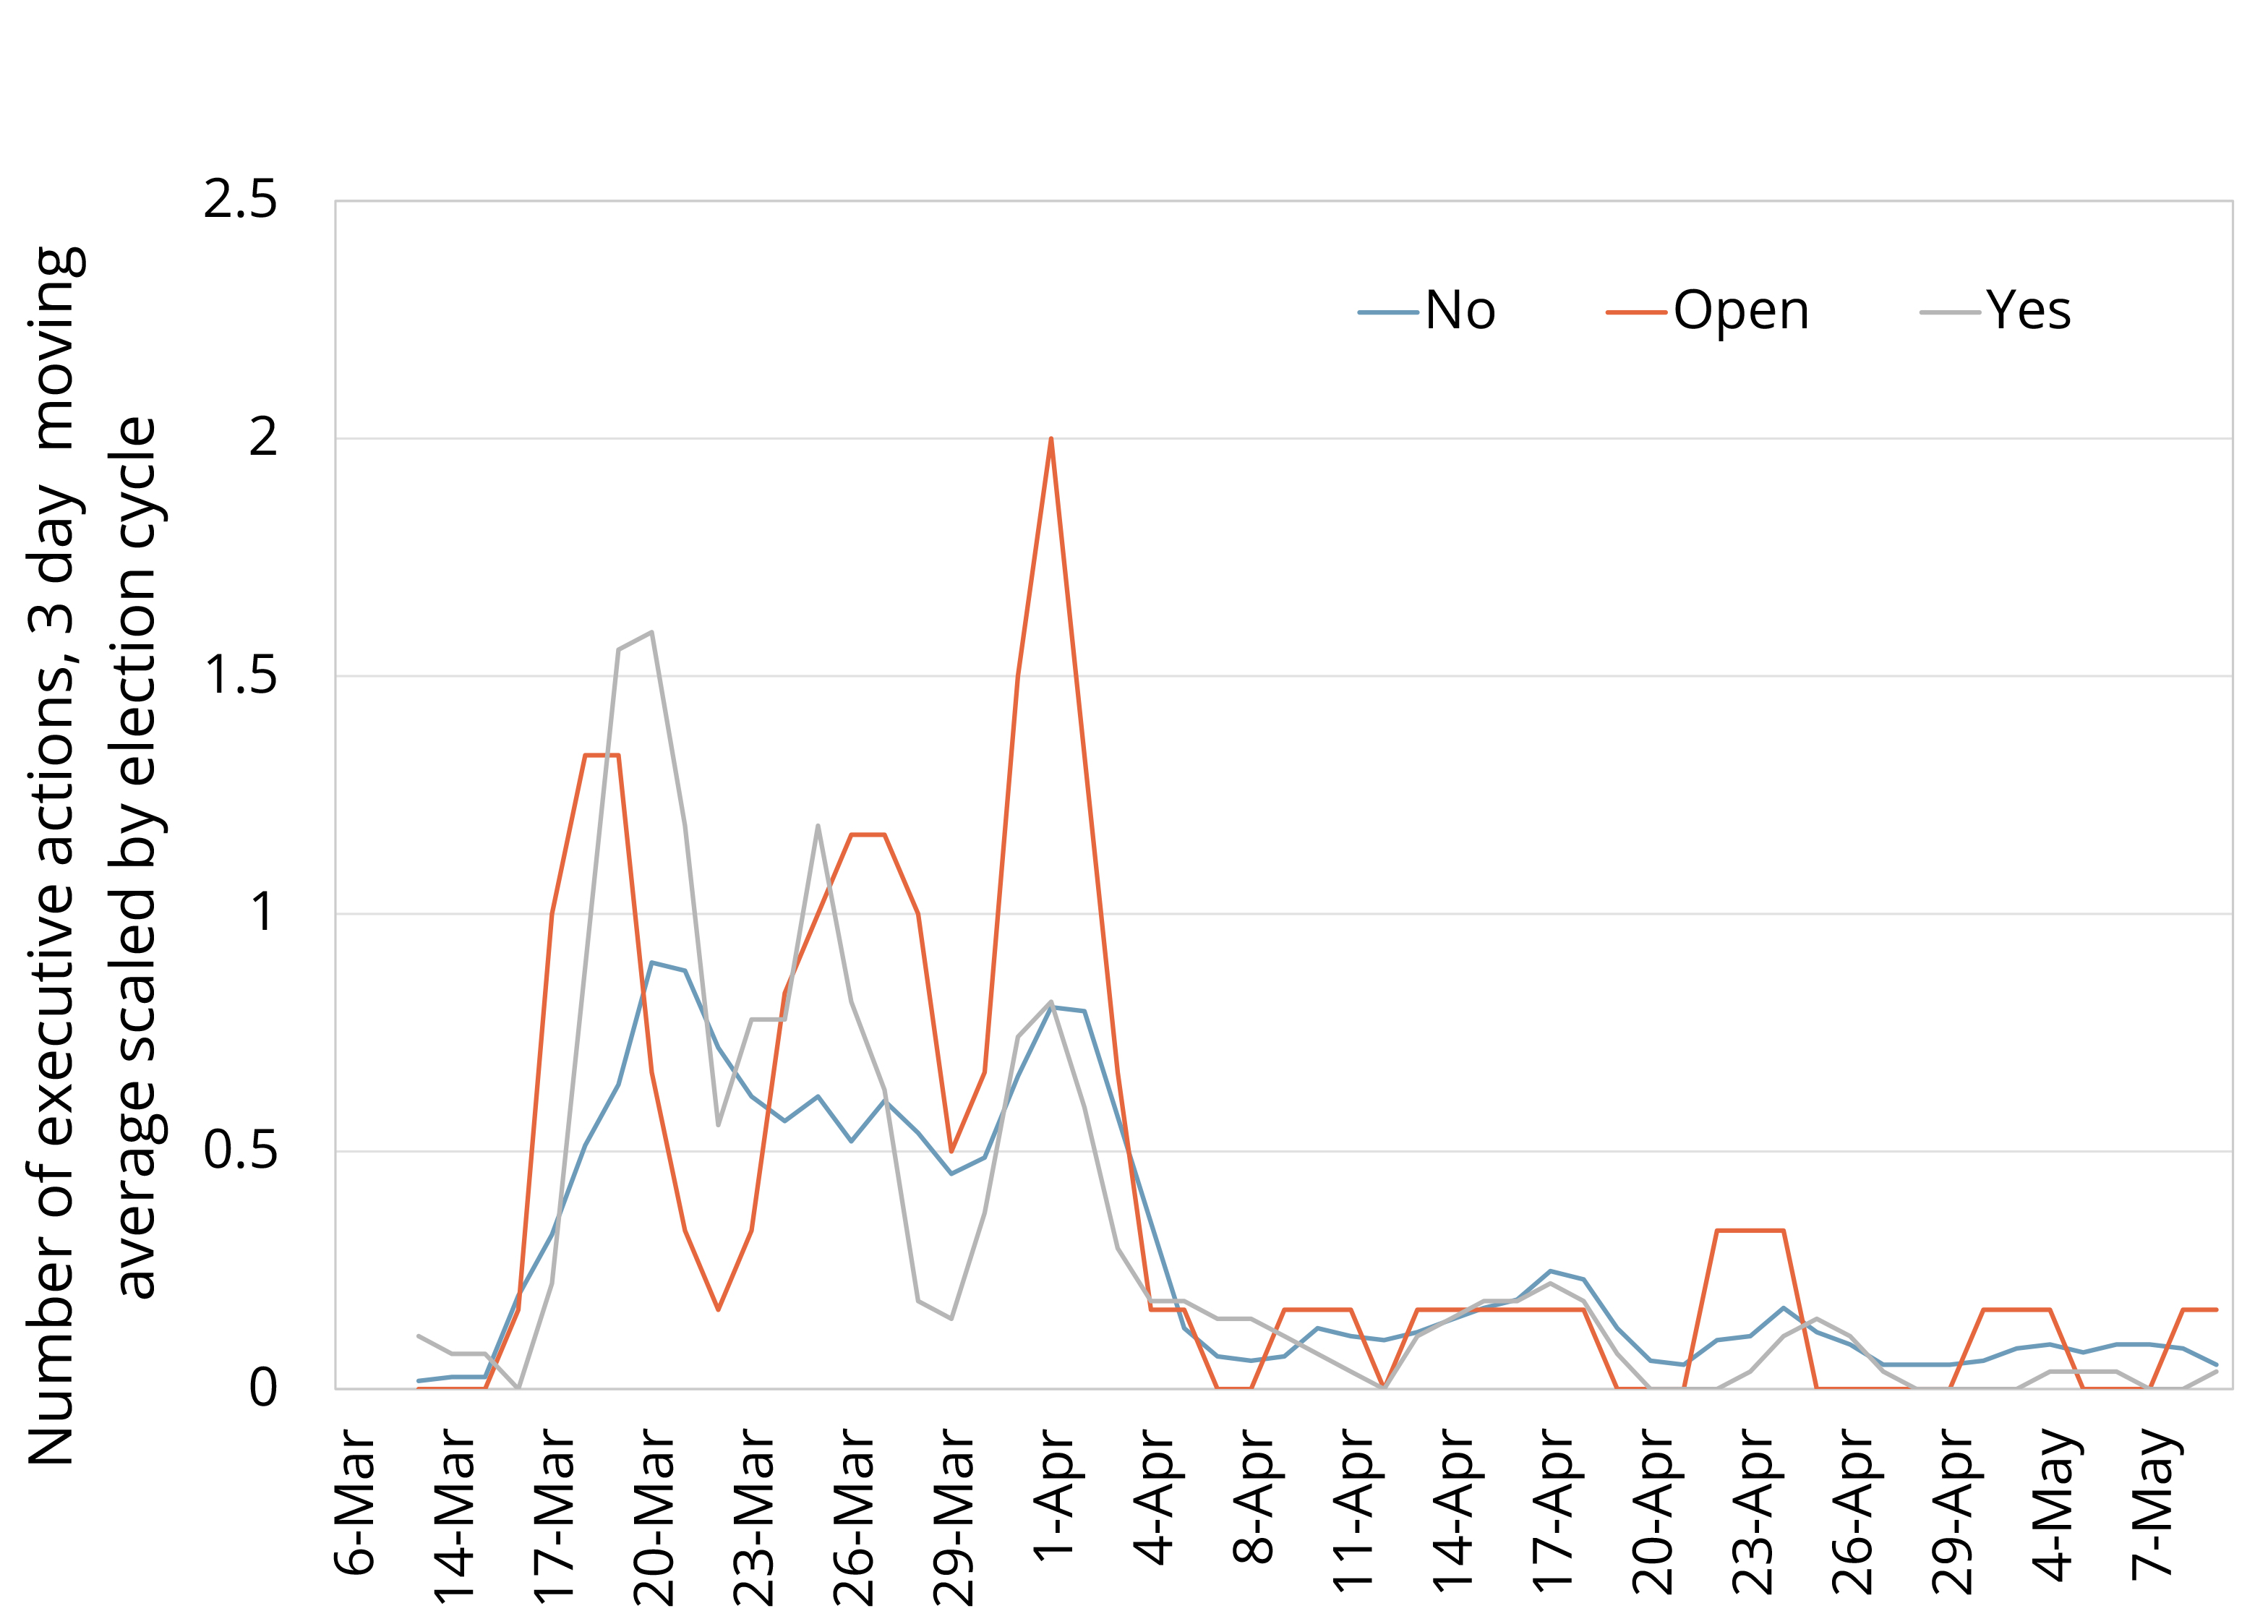
One trend we did find is that governors’ responses have differed by election-cycle status.3 As seen in FIGURE 2, in states with an upcoming gubernatorial election, governors not seeking reelection have implemented more executive actions (21 per state), on average, than others. Compared to states with governors not up for reelection (15.3 per state) and states with governors running for reelection (16 per state), this may indicate that election pressures have affected the state response. However, at the start of the COVID-19 crisis, governors up for reelection, on average, implemented slightly more executive actions. Within the first two weeks after the issuance of the first executive action relating to COVID-19, the number of executive actions taken by governors seeking reelection was 10 per governor versus eight actions per governor not seeking reelection and seven actions per governor in states without an upcoming gubernatorial election.
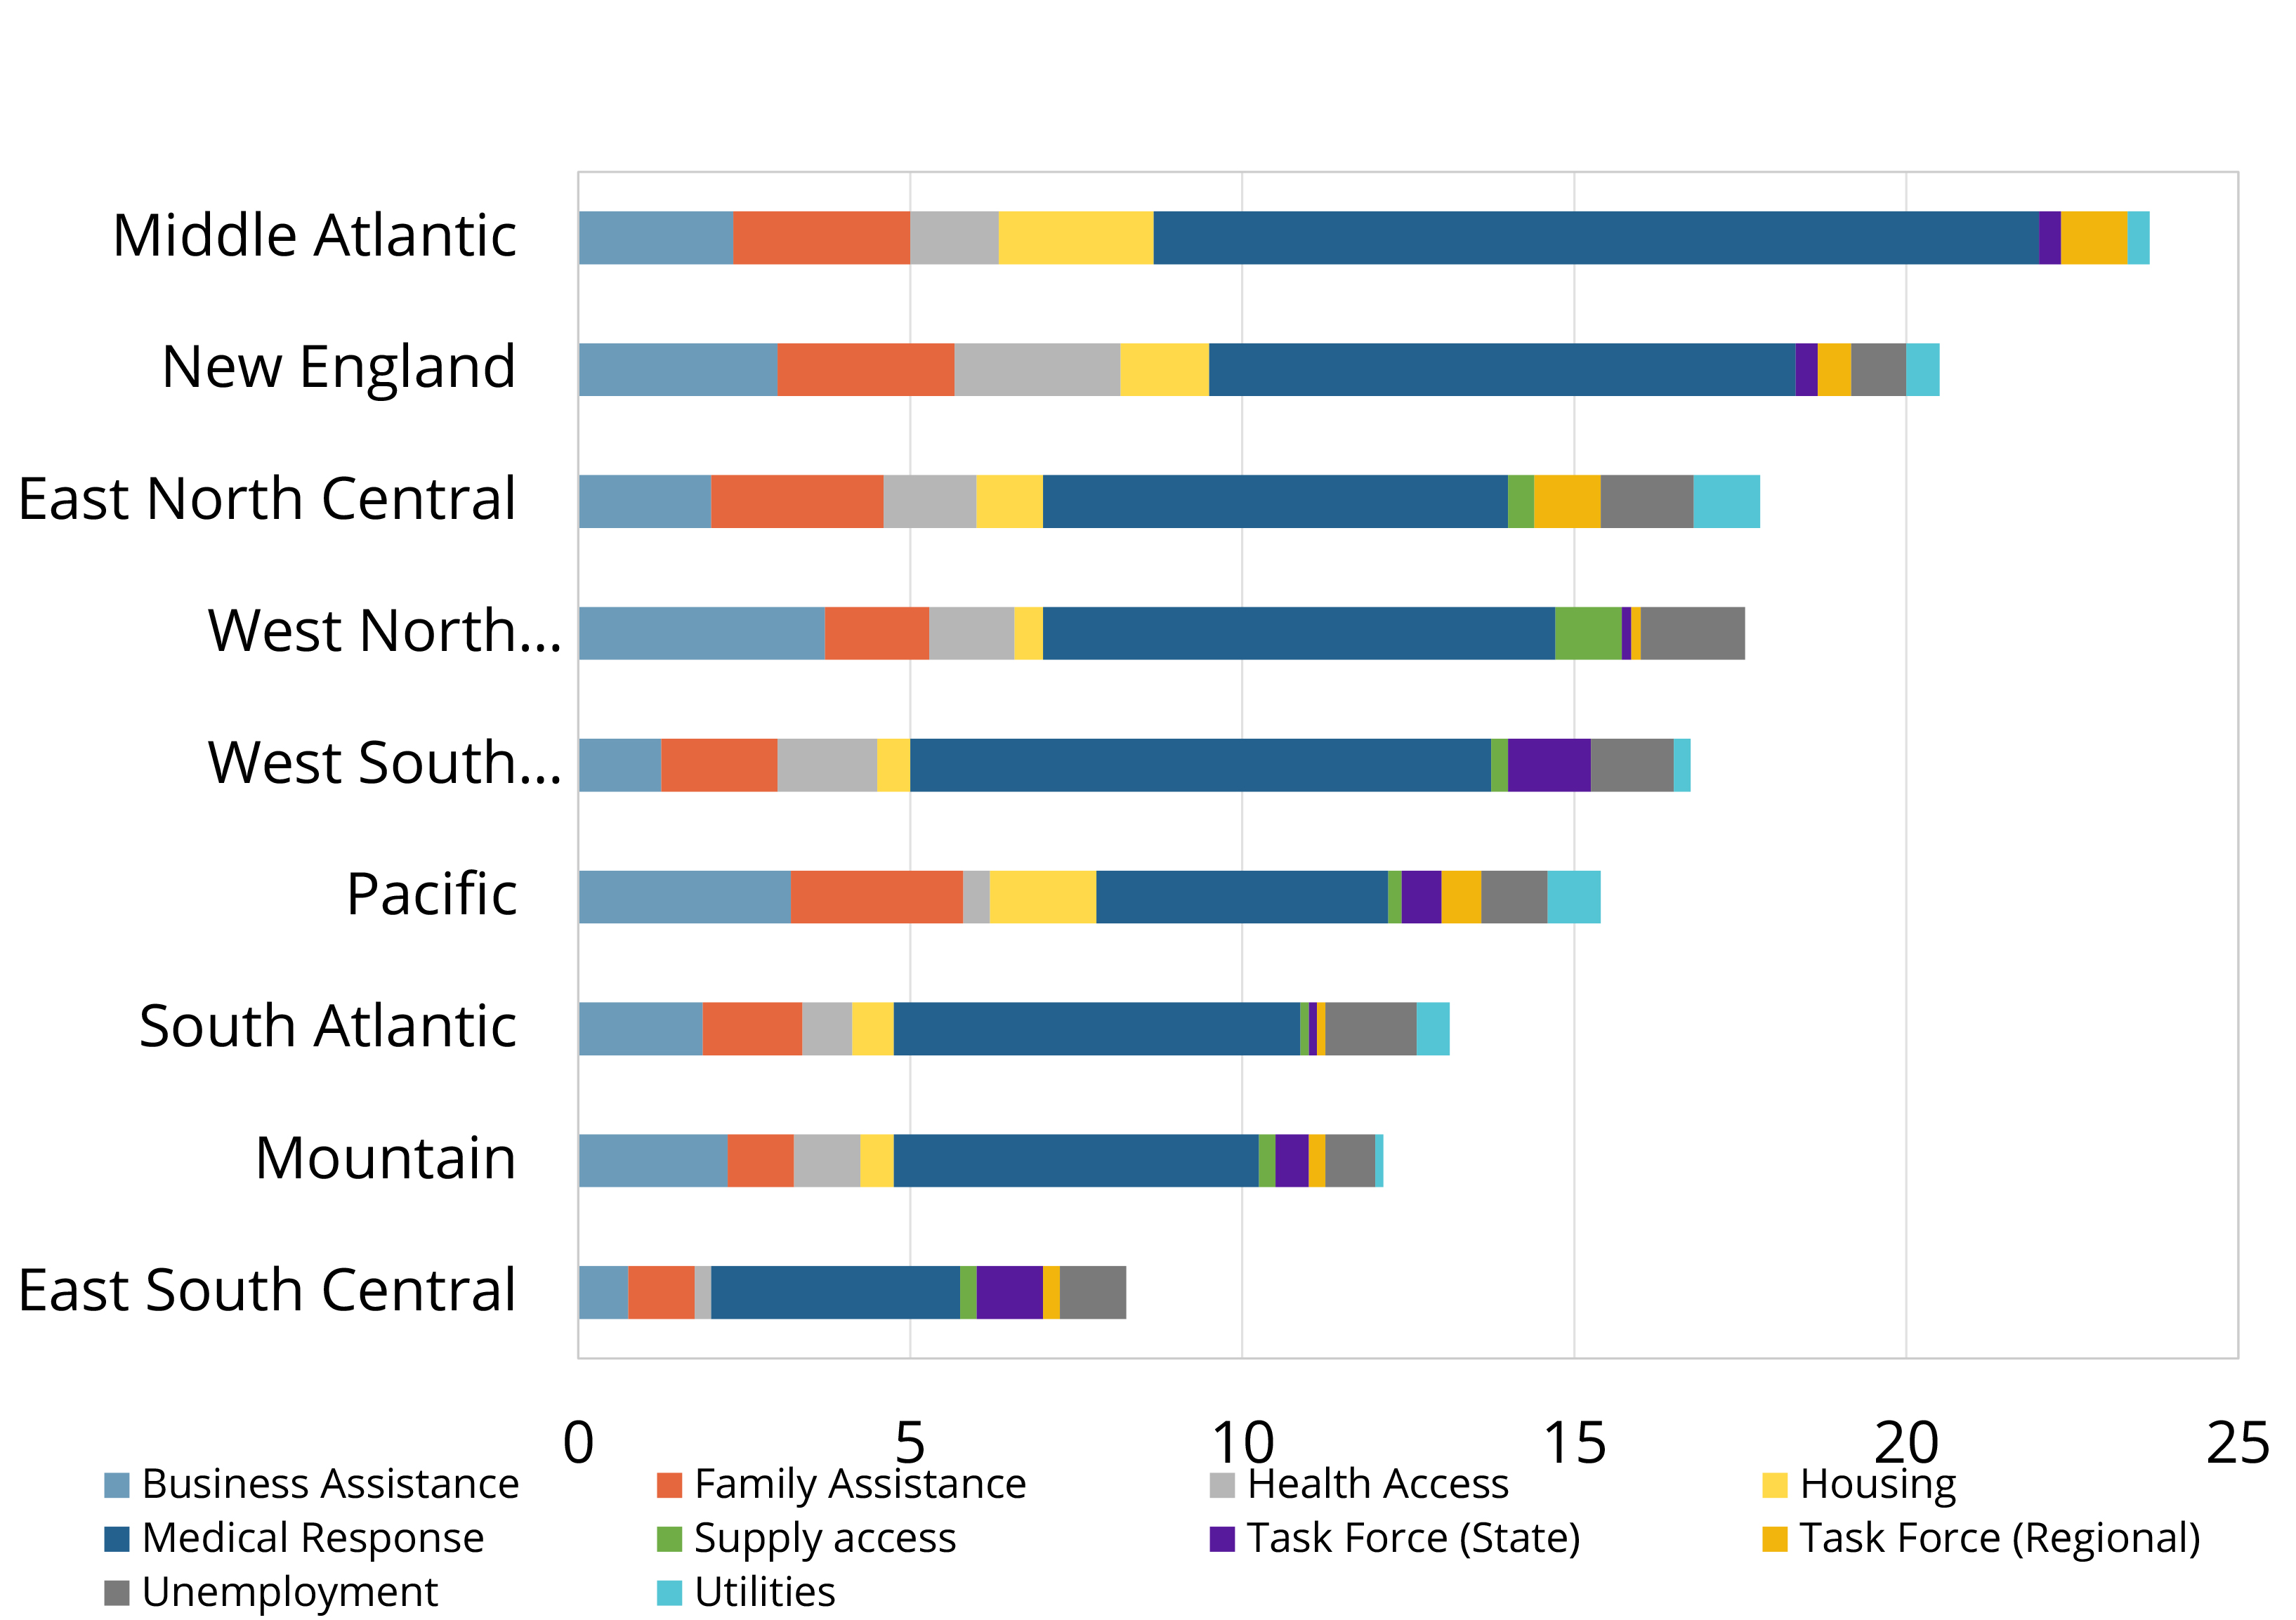
Regionally, the story is slightly different, with governors’ responses varying somewhat by region.4 The West North Central region has implemented the most executive actions in total (123 per region), while the East South Central region has implemented the fewest (33 per region). When scaled by state, the Middle Atlantic region has implemented the most actions per state (23.6), while the East South Central region has implemented the fewest per state (8.25).5
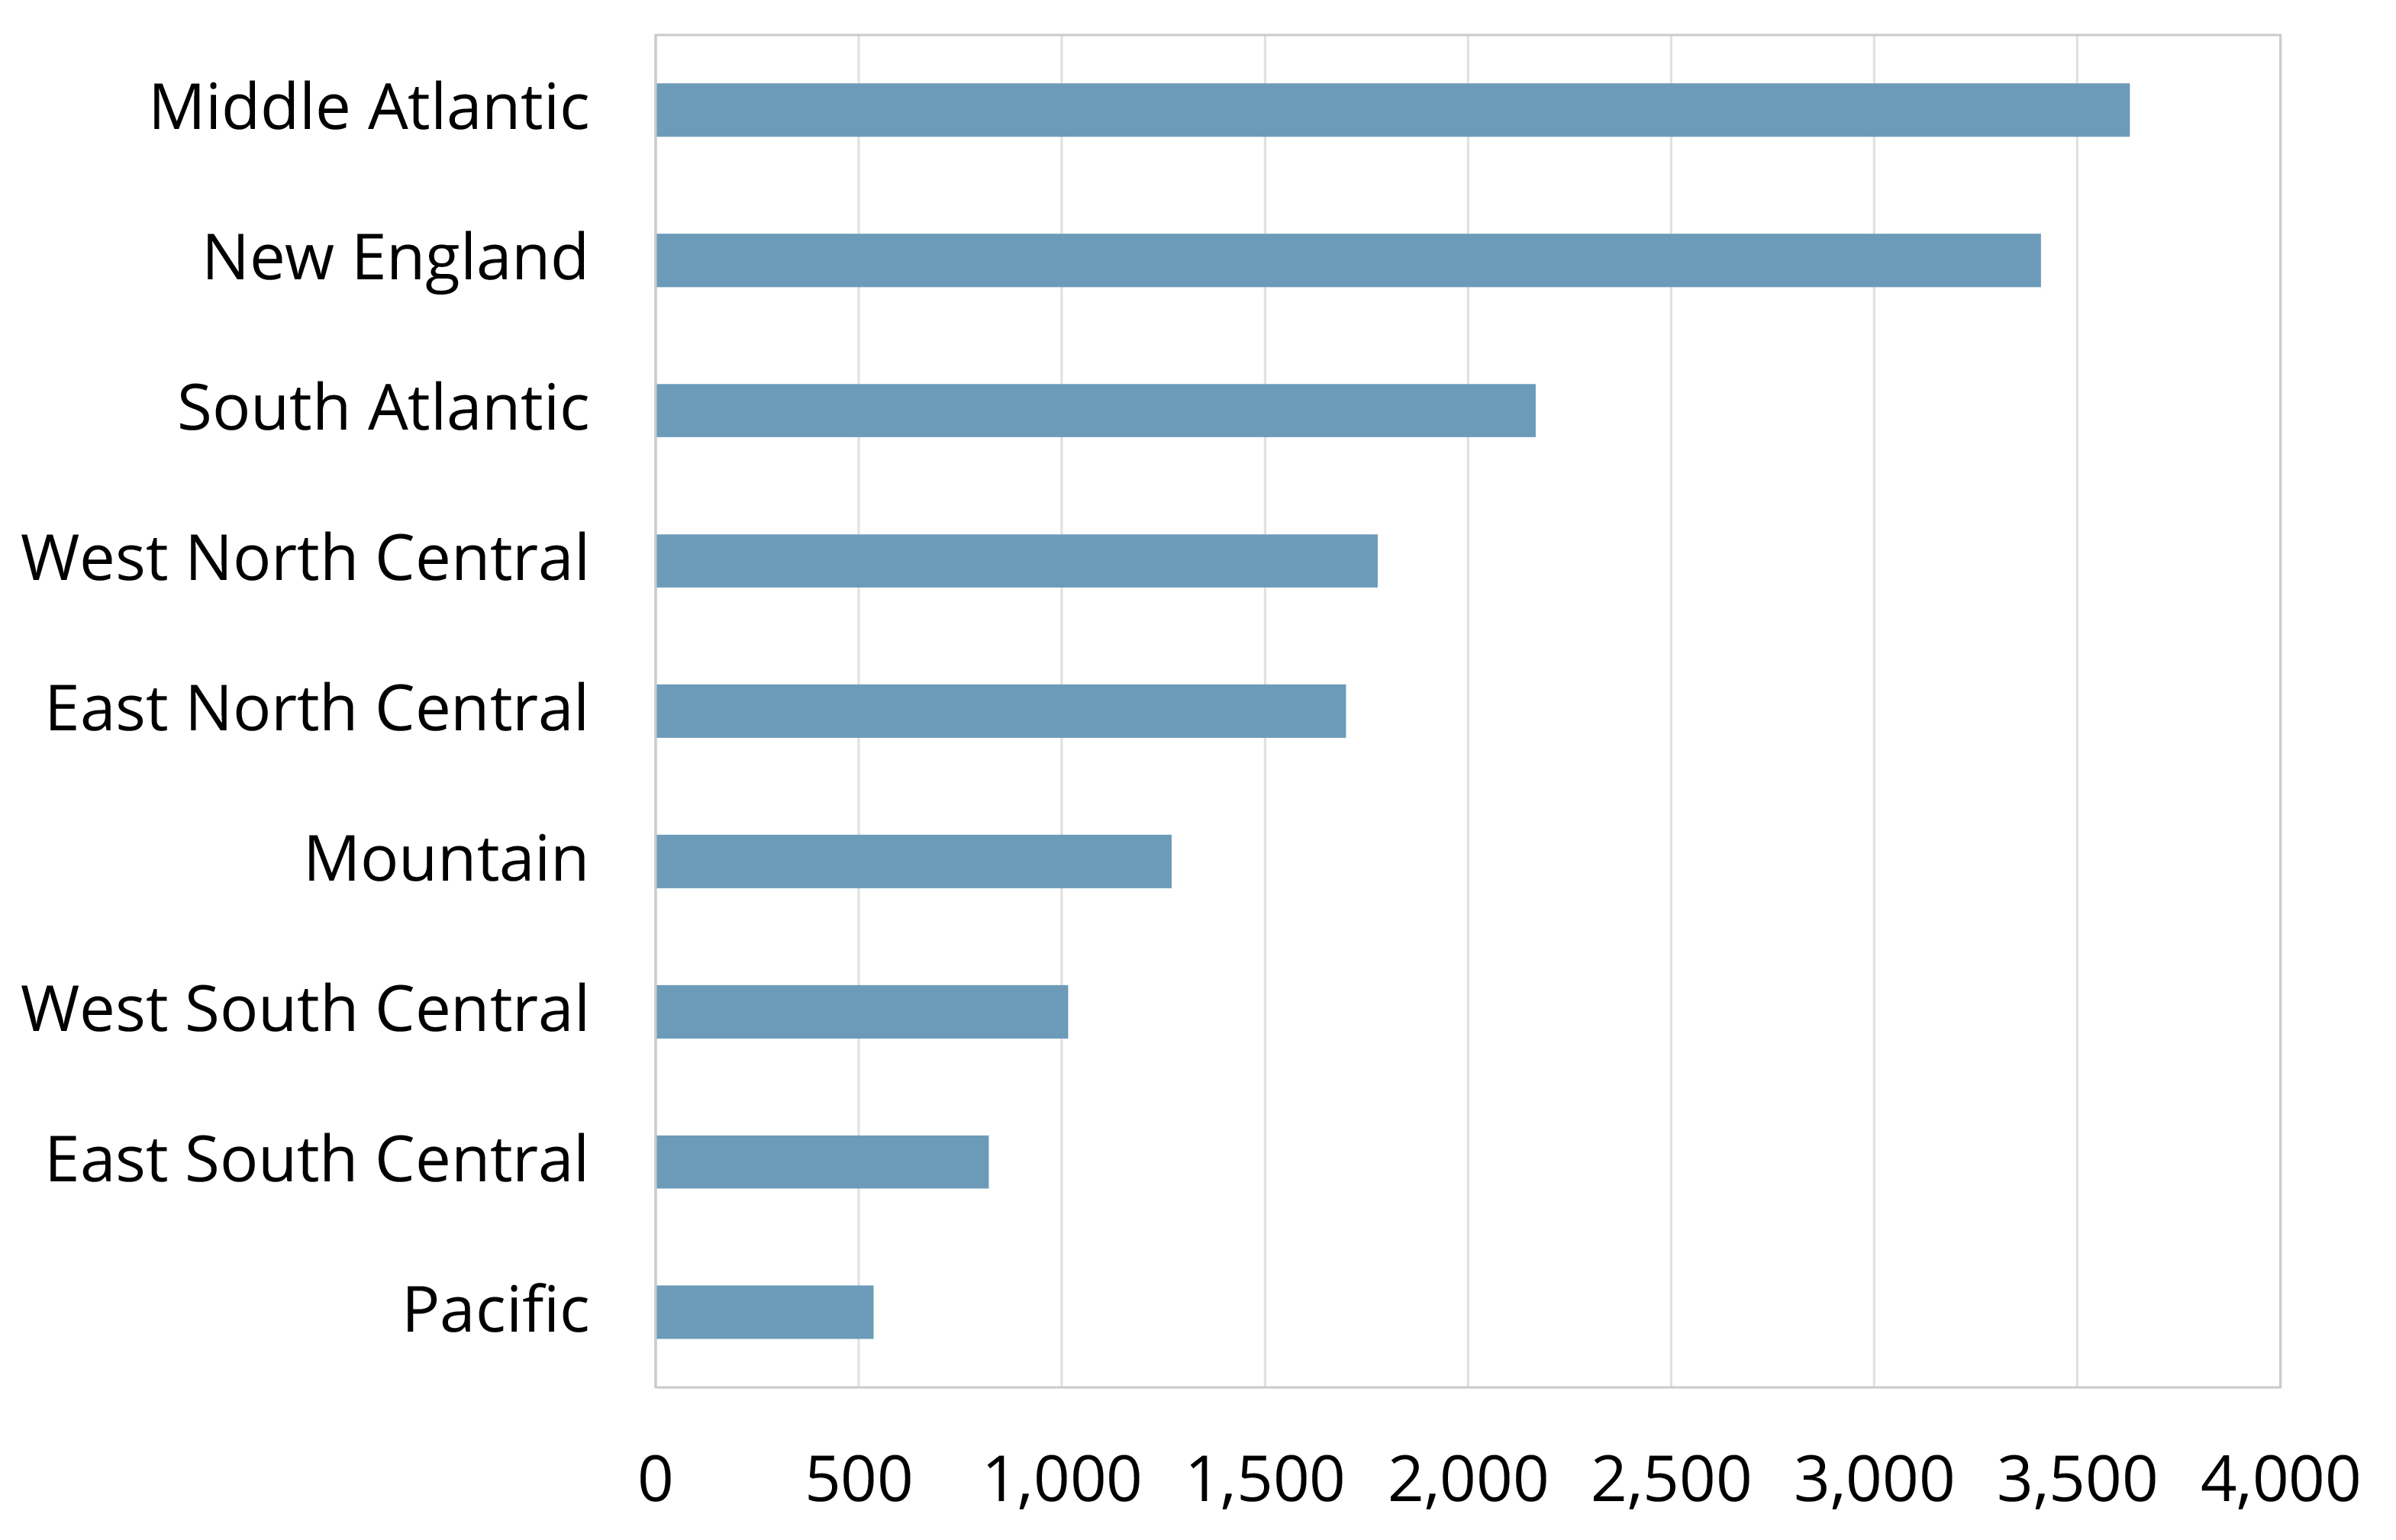
When comparing the number of executive actions per state by region with the number of confirmed COVID-19 cases as of May 7, 2020, an interesting trend emerges that suggests states with more confirmed cases responded with an increased number of executive actions. As seen in FIGURE 4 and FIGURE 5, the Middle Atlantic and New England regions both had the highest number of confirmed cases as of May 7 (3,639 and 3410 per 100,000, respectfully) and the most executive actions (23.7 and 20.5, respectfully). On the other extreme, the East South Central region had the second lowest number of confirmed cases (1699 per 100,000) and the fewest executive actions (8.25). This trend, however, does not hold steady throughout all regions. For example, the South Atlantic region has the third highest number of cases as of May 7 (2,167 per 100,000), but also the third lowest number of executive actions (13.1).
While it is too early to conclude the overall effects of these actions on long-term economic recovery, it is clear that states are battling competing tensions between the need to keep communities safe and healthy amid COVID-19 and the need to start economic recovery to help alleviate the dire financial situation facing many individuals, families and businesses.
2 See Executive Action Types per State, by Governor Partisanship on accompanying factsheet
3 Not up for re-election includes the 39 states that are not holding gubernatorial elections in 2020. Open seat includes the 2 states (MT, UT) with 2020 gubernatorial elections whose current governors are not running again. Up for re-election includes the 9 states (DE, IN, MO, NH, NC, ND, VT, WA, WV) whose current governors are running for re-election in 2020.
4 Census regions: New England (CT, ME, MA, NH, RI, VT); Middle Atlantic (NJ, NY, PA); East North Central (IN, IL, MI, OH, WI); West North Central (IA, KS, MN, MO, NE, ND, SD); South Atlantic (DE, FL, GA, MD, NC, SC, VA, WV); East South Central (AL, KY, MI, TN); West South Central (AR, LA, OK, TX); Mountain (AZ, CO, ID, NM, MT, UT, NV, WY); Pacific (AK, CA, HI, OR, WA)
5 See accompanying factsheet for Figure: Total Executive Actions by Region
6 Calculated using 2019 U.S. Census population estimates