How the U.S. ‘Exports Inflation’ Through a Strong Dollar
A sushi meal in Japan would have cost an American visitor about $25 at the beginning of 2022. After accounting for Japanese inflation, that price is down to about $20 at the end of October, because the U.S. dollar has appreciated a whopping 27% against the Japanese yen this year.
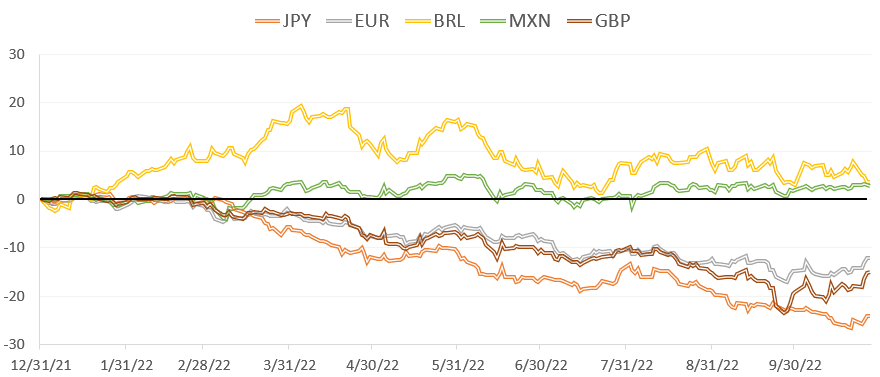
The yen is in good company. Figure 1 shows that at one time recently this year, the euro and the British pound had lost between 20% and 30% of their value against the dollar. These are extremely large movements. To put things in perspective, consider that the volatility of the rate of change of the dollar-yen exchange rate is on the order of 10% a year over the course of the last 20 years. This means that the 27% appreciation that has materialized so far this year is almost a 3 standard deviation event by historical benchmarks.
Figure 1: Change of value of the Japanese yen (JPY), the euro (EUR), the Brazilian real (BRL), the Mexican peso (MXN) and British pound (GBP) vs. the U.S. dollar year to date. The Dollar Spot Index is constructed by Bloomberg as a weighted average of a basket of foreign currencies. Source: Bloomberg.

Why are these large currency movements important for global markets? For starters, the dollar is the currency of choice when firms borrow in international financial markets. Colacito, Qian, and Stathopoulos (2022) show that firms in the 10 countries with the most actively traded global currencies issue more than a sixth of their debt in U.S. dollars even in the absence of any sales in the United States. A strong dollar directly affects the cost of servicing the debt for these companies. At a time in which global financial conditions are tightening at a fast pace, a strong dollar compounds the effect of rising interest rates.
Emerging markets are often cited as being particularly at risk when the dollar appreciates. This is due to their larger degree of reliance of sovereign and corporate dollar borrowing compared with the group of developed countries. But looking at Figure 1, we can observe that the currencies of some of these emerging countries are on the lower end of the spectrum when it comes to their loss of value vis-à-vis the dollar during the last year.
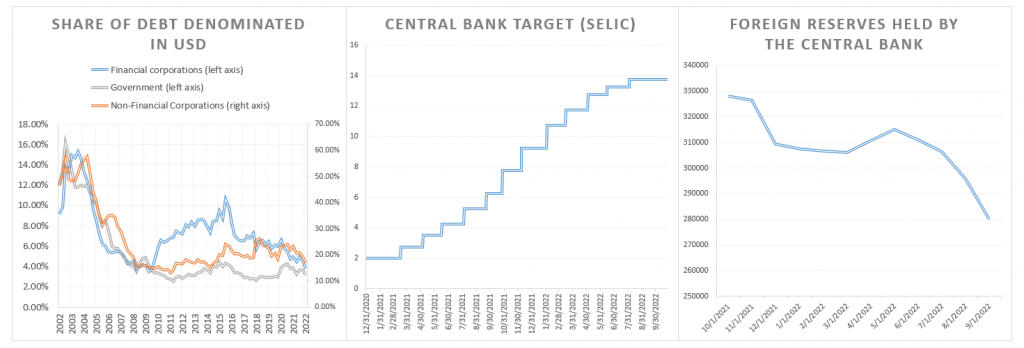
The case of Brazil offers interesting insights into the way in which emerging and developing countries have entered the new era of the strong dollar. Figure 2 shows that over time, Brazil has substantially reduced its share of borrowing denominated in dollars. The phenomenon is more apparent for borrowing by the government and financial institutions and it has been on a steady decline for non-financial corporations, which are still issuing about 20% of their debt in dollars. Figure 2 also documents that foreign reserves in Brazil have declined by about 10% this year.
Figure 2: The case of Brazil. The left panel reports the share of outstanding debt issued by government, financial and non-financial institutions denominated in U.S. dollars. (Source: Bank for International Settlements.) The middle panel shows the Selic rate between Dec. 31, 2020, and end of October 2022. (Source: Bloomberg.) The right panel reports the international reserves held by the central bank in millions of U.S. dollars over the last year. (Source: Bloomberg.)

Foreign exchange interventions have not been confined to Brazil, as the foreign reserves held by this broader group of countries has declined by 6% since the beginning of the year. Furthermore, Figure 2 shows that Brazil has been ahead of the cycle in terms of monetary tightening. The Selic target rate (the Brazilian equivalent of the Federal Reserve’s federal funds rate) has been on a sharp rise from 2% to the current 13.75% starting in March 2021. This is one full year ahead of Fed Chairman Jerome Powell’s liftoff decision. The combined effect of these policies has allowed the currencies of some of these countries to remain more stable during these unique times of global dollar strengthening.
As the return of high levels of inflation has dominated global headlines for a good part of the last year, it’s natural to ask what the connection is between high global inflation and a strong dollar. Gita Gopinath, the first deputy managing director of the International Monetary Fund, has done extensive work on this topic (see, for example, Gopinath [2015]). The rate of inflation of a country depends on the changes in the value of the currencies by which its imports are invoiced. If all a country’s imports were invoiced in U.S. dollars, for example, the passthrough of a stronger dollar into domestic inflation would be substantial.
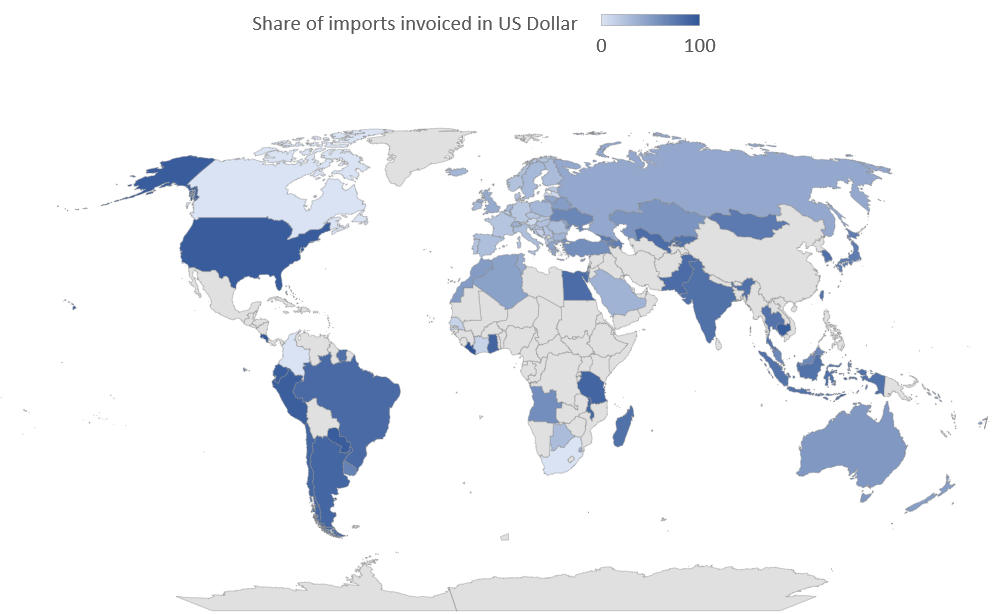
The practice of invoicing imports in dollars is widespread in the global economy, and Figure 3 shows that this is not confined to developing countries. Consider again the case of Japan, which is directly analyzed by Gopinath. About 70% of Japanese imports are invoiced in dollars, which exposes this country to a high risk of passthrough inflation. The historical evidence shows that a 10% appreciation of the dollar vs the yen (equivalently, a 1 standard deviation movement) results in a 9% increase in import prices for Japan; that’s a 90% passthrough rate. This could be responsible for part of the increase in Japanese inflation that has taken place during the last year. In contrast, the United States enjoys a status of “privileged insularity” since nearly all of its imports are invoiced in dollars. A strong dollar acts as a mechanism to “export inflation” to the rest of the global economy.
Figure 3: Share of imports invoiced in U.S. dollars. Averages over the 1990-2020 sample. Source: Boz et al. (2020), “Patterns in Invoicing Currency in Global Trade,” IMF Working Paper 20/126.

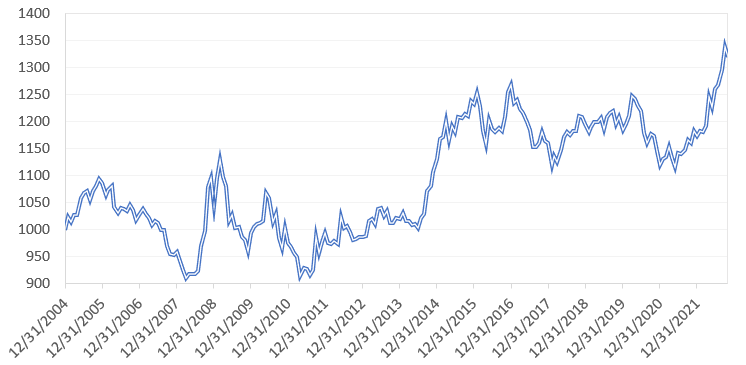
It is hard to predict when and if the dollar is going to return to its pre-2022 levels. Historically, within one year of an appreciation of 20% or more against a basket of major currencies, the dollar loses about half of its appreciation (see Figure 4). With the interest rates of many industrialized countries still lagging U.S. rates and with the uncertainty surrounding the Ukraine-Russia conflict, it is likely that the dollar will continue being a strong currency for the foreseeable future. Governments, central banks and corporations should monitor these evolutions and their repercussions on global financial and goods markets.
Figure 4: Bloomberg Dollar Spot Index. The index tracks the performance of a basket of 10 leading global currencies versus the U.S. dollar. Each currency in the basket and their weight is determined annually based on their share of international trade and foreign exchange liquidity. Source: Bloomberg.

