Decoding the Worst Quarter in Economic History
This month the full scale of the economic devastation from COVID-19 will become apparent as we start seeing more data from the second calendar quarter (Q2). However, understanding exactly what these data say about the full impact on households and businesses is going to be particularly challenging because unique aspects of the pandemic distort the data. So how do we take what we can learn from the data and use this knowledge to guide a restart, and eventual full recovery, of the economy?
This article looks at several recent data releases describing what happened to the U.S. economy in April, and helps make sense of what they say about how the economy has contracted to date. We look at measures gauging the effects on businesses, as well as on workers and households. We dig in deeper than usual to understand with more precision what is actually happening to the economy, because these data have some peculiar features caused by supply chain disruptions, stay-at-home orders and CARES Act influences. We utilize this analysis in making an assessment that U.S. Gross Domestic Product (GDP) will contract about 35 percent in Q2 (at a seasonally adjusted annual rate), which is on the weaker end of current estimates. We also examine the pivotal role of retail activity from consumer and business perspectives for insight into what will happen as the economy attempts to restart. Finally, we recommend shifts in policy that will help dampen further declines in jobs and accelerate economic recovery.
What do the April data really tell us?
While we are just starting to see the full spectrum of economic statistics for April, there are two sets of reports that provide broad views of how the contraction unfolded: The U.S. Bureau of Labor Statistics’ Employment Situation and the Institute for Supply Management (ISM) Reports on Business. Historically, these reports have provided timely and accurate information on economic activity from both the business and household perspective.
| Table 1: Business Survey Data from the Institute for Supply Management | |||
|---|---|---|---|
| Indicator | Feb. | Apr. | Change |
| ISM Manufacturing Composite | 50.1 | 41.5 | -8.6 |
| Production | 50.3 | 27.5 | -22.8 |
| Employment | 46.9 | 27.8 | -19.1 |
| New Orders | 49.8 | 27.1 | -22.7 |
| ISM Non-Manufacturing Composite | 57.3 | 41.8 | -15.5 |
| Business Activity | 57.8 | 26.0 | -31.8 |
| Employment | 63.1 | 30.0 | -33.1 |
| New Orders | 55.6 | 32.9 | -22.7 |
|
* Source: Institute for Supply Management, April Reports on Business
|
|||
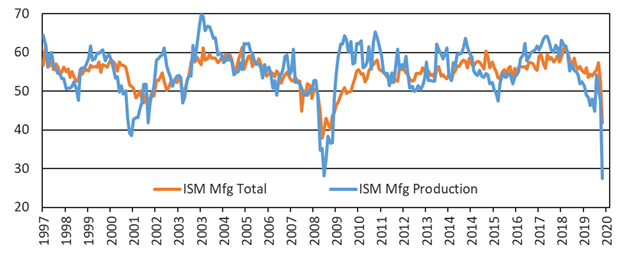
The ISM Reports on Business comprise two surveys, one for the manufacturing sector and another for the nonmanufacturing sector. The reports provide results from a large-sample survey of businesses in many industries about what is happening with different aspects of their operations, and are available the first week of the month for the previous month’s results. Historically, the ISM reports have given a very accurate, and almost real-time, read on what is happening to private sector business in the U.S. At first blush, the news for April looks bad, but better than expected – the headline numbers for the ISM surveys were down considerably, but not nearly as much as was expected given anecdotal reports. For example, the composite indices declined less than during the 2008 financial crisis, despite widespread views that the current situation is much worse (see orange lines in Figures 1 &2).
However, these headline ISM numbers are misleading because of disruptions in the U.S. and global supply chains caused by the pandemic, which have had perverse effects on certain sub-components. For example, both surveys show that slower supplier deliveries resulted in a large positive contribution. In normal times, slower deliveries are a sign of a hot economy, but in April these were caused by stay-at-home orders that caused many nonessential businesses to close coupled with parts of the transportation system that became overwhelmed by rapid shifts in demand. Likewise, the nonmanufacturing report showed an increase in prices, which provided a bump to the composite index. Yet this was not the result of a strong economy driving up demand, but instead a scarcity of certain intermediate inputs that were in short supply because of the pandemic.
To understand what was actually happening with businesses overall in April, it is necessary to focus in on some specific subcomponents of the ISM reports. In particular, the employment, new orders, and business activity (production) indices provide a much starker view of the contraction in private sector business. We examine what each tells us about the current situation by examining changes from February, in which economic activity in the U.S. peaked, to April (see Table 1). For example, the blue lines in Figures 1 and 2 show that the production index (for manufacturing) and business activity index (for nonmanufacturing) each declined more than twice as much as their respective composite index. In fact, the subcomponent contractions are the worst on record. Overall, the ISM reports reveal widespread and deep contraction across almost all industries except healthcare supplies, food and beverage manufacturing, public administration and financial services.
The second set of data releases we examine are labor market indicators for April. Just two months ago, the labor market was booming, hitting record low unemployment rates. But as has been well documented now, the U.S. labor market has plummeted due to COVID-19. Still, the recent data releases have been distorted in unusual ways by the pandemic, so a careful read of the data is necessary to understand the full impact of the employment crisis unfolding in the U.S.
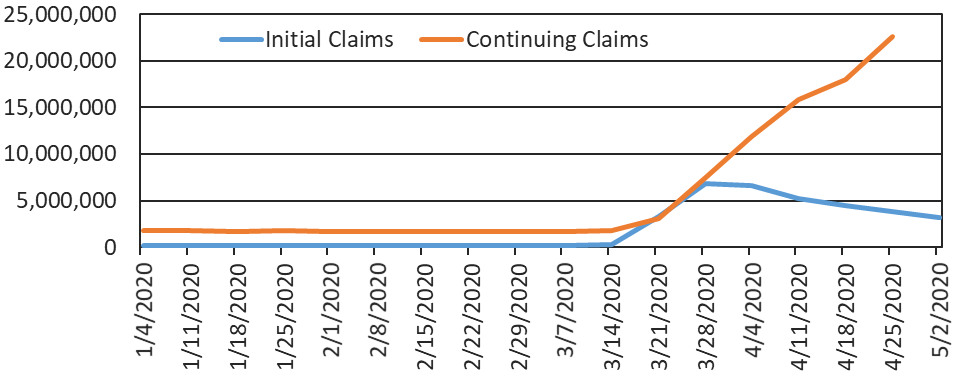
The timeliest data for the labor market are the weekly claims for unemployment insurance. These are released each week for the previous week and have shown an unprecedented spike starting in late March and peaking in mid-April (see Table 2 and Figure 3). While these data are both important and timely, they are plagued by a host of issues that make them, at best, a rough take on the overall impact on workers. For example, the CARES Act increased unemployment benefits not just to help soften the financial blow to households, but also to encourage people to stay home as a health measure to reduce the spread of COVID-19. Thus, some of those making claims may be quick to return to work as the economy reopens. Likewise, new claims are only a measure of people losing jobs, and provide little information on new job creation (which has been small in comparison to losses, but not insignificant). Continued claims data provide a better measure of overall and cumulative job losses, and are available with a one-week lag. Continued claims through the week of April 25 show a record 17.1 million people receiving benefits, which represents 15.5% of covered employees in the U.S. While staggering, these numbers may even underestimate the overall economic impact of the pandemic, because some additional workers are idle but being paid by employers (either through standard employment or the Paycheck Protection Program). In sum, the claims data do not let us get a very precise or granular view of what is happening in the economy.
| Table 2: U.S. Unemployment Insurance Claims | |||||
|---|---|---|---|---|---|
| Initial Claims | Continued Claims | ||||
| Seasonally Adjusted | 4-Week Moving Average | Seasonally Adjusted | 4-Week Moving Average | Covered Employment | |
| 3/7/2020 | 211,000 | 215,750 | 1,702,000 | 1,703,500 | 145,230,691 |
| 3/14/2020 | 282,000 | 232,500 | 1,784,000 | 1,726,250 | 145,230,691 |
| 3/21/2020 | 3,307,000 | 1,004,250 | 3,059,000 | 2,061,000 | 145,230,691 |
| 3/28/2020 | 6,867,000 | 2,666,750 | 7,446,000 | 3,497,750 | 145,230,691 |
| 4/4/2020 | 6,615,000 | 4,267,750 | 11,914,000 | 6,050,750 | 145,671,710 |
| 4/11/2020 | 5,237,000 | 5,506,500 | 15,819,000 | 9,559,500 | 145,671,710 |
| 4/18/2020 | 4,442,000 | 5,790,250 | 18,011,000 | 13,297,500 | 145,671,710 |
| 4/25/2020 | 3,846,000 | 5,035,000 | 22,647,000 | 17,097,750 | 145,671,710 |
| 5/2/2020 | 3,169,000 | 4,173,500 | |||
| Continuing as Percent of Covered Employment: | 15.5% | ||||
|
* Source: U.S. Department of Labor
|
|||||
By far the most important report to date for April is the U.S. Employment Situation that was released Friday, May 8, by the Bureau of Labor Statistics. This report provides detailed information on households, as well as specific payroll information from hundreds of thousands of companies. As of April 2020, the unemployment rate soared to 14.7 percent, the highest unemployment rate recorded since the start of the Current Population Survey in 1948, and an increase of 11.2 percentage points since February. These numbers are much more dire than those during the Great Recession, when the unemployment rate peaked at 10 percent (October 2009), and are the highest since the Great Depression, when the unemployment rate is believed to have peaked at 25 percent (Margot, 1993).
Still, 14.7 percent might be severely underestimating the true magnitude of the unemployment rate in the U.S. as of April 2020. According to the BLS, an individual is employed if he or she does not work for the entire reference week for certain reasons, such as vacation, paternity/maternity leave or military duty. In April 2020, 8.1 million people responded that they are employed, but did not work for the entire reference week for “other reasons.” This is much higher when compared with the average number of 620,000 individuals who reply they are out of work for “other reasons.” Thus, it is possible that as many as 7.5 million people may have been misclassified as working, while in reality they are unemployed or temporarily laid off. According to the BLS, the overall unemployment rate would be almost five percentage points higher if those individuals were reclassified as unemployed, in which case the unemployment rate would be much closer to the peak rate of the Great Depression.
Amidst a broad-based and sudden collapse of the labor market, there are also many workers who want a job, but are not actively looking. Specifically, 2.3 million individuals (an increase of 840,000 since February) replied that they are interested in working and have looked for a job in the past year. These workers are not considered unemployed when calculating the headline unemployment rate. The BLS measure that accounts for these marginally attached and discouraged individuals (known as the U-5 measure) climbed to 16% in April, significantly higher than the February rate (4.4%). Even worse, when the BLS also accounts for individuals who are employed part time because they cannot find a full-time job due to a slack labor market (U-6 measure), the unemployment rate soars to 22.8%, more than triple the 7% rate recorded in February.
It is thus apparent that there has been an increase in both individuals who are unemployed and those who are not actively seeking a job. This explains the sharp drop in the employment-to-population ratio to 51.3% in April (a decline of 9.8 percentage points since February) and in the labor force participation rate (60.2% in April).
| Table 3. U.S. Household Survey Data | |||||
|---|---|---|---|---|---|
| Indicator | Feb. | Apr. | Change | ||
| Total Unemployment Rate (U-4) | 3.5% | 14.7% | 11.2% | ||
| Broad Unemployment Rate (U-6) | 7.4% | 22.8% | 15.4% | ||
| Labor Force Participation Rate | 63.4% | 60.2% | -3.2% | ||
| Adult Men | 3.3% | 13.0% | 9.7% | ||
| Adult Women | 3.1% | 15.5% | 12.4% | ||
| White | 3.1% | 14.2% | 11.1% | ||
| Black | 5.8% | 16.7% | 10.9% | ||
| Asian | 2.5% | 14.5% | 12.0% | ||
| Hispanic/Latino | 4.4% | 18.9% | 14.5% | ||
| College or Higher | 1.9% | 8.4% | 6.5% | ||
| High School, but No College | 3.6% | 17.3% | 13.7% | ||
| Less than High School Diploma | 5.7% | 21.2% | 15.5% | ||
| Part-time for Economic Reasons (million) | 4.3 | 10.9 | 6.6 | ||
|
* Source: U.S. Department of Labor, Bureau of Labor Statistics
|
|||||
Most likely, the unemployment rate in the U.S. has not yet reached its peak. We expect the labor market outlook in May to be even worse. The survey that produced the April unemployment data was performed the week ending April 18. As shown above, 7 million individuals have filed an initial unemployment claim since then. However, there might be a glimpse of hope in these data. Temporary layoffs account for 18.1 million individuals (78.3% of those unemployed). Moreover, benefits due to the CARES Act are better paying than jobs, so people are reluctant to go back to work. If the threat of the virus dissipates or economic life adapts to it, there is hope that a large fraction of these individuals can go back to work quickly.
Unemployment rates are high across the board. However, the April data reveal a gender gap. The female unemployment rate increased to 15.5% in April, higher than the male unemployment rate of 13%. The unemployment rate also exhibits variation across race: the unemployment rate for Hispanics is 18.9%, followed by the rate for Blacks (16.7%), Asians (14.5%) and whites (14.2%). Most of these differences may be explained by the sectoral and occupational heterogeneity of the different groups. For example, women are more likely to be working in sectors heavily affected by the epidemic, such as leisure and hospitality and healthcare.
Moreover, the biggest surge is observed among individuals who have less than a high school diploma, with the unemployment rate soaring to 21.2% (an increase of 15.5 percentage points since February), while the least affected are those with higher education, with an unemployment rate of 8.4% (an increase of 6.5 percentage points since February). This difference should be mostly attributed to the fact that stay-at-home orders make it nearly impossible for nonessential workers who cannot work from home (mostly less skilled workers) to continue working.
Finally, employment has contracted across all major sectors. The establishment survey of businesses shows that the bulk of employment losses (17.9 million of the 20.4 million total) are in the service sector (see Table 4). Government payrolls were least affected, but still experienced a decline of 1 million jobs. As shown in Table 5, the leisure and hospitality sector has been affected the most, experiencing a decline in employment of 48.3 percent between February and April, followed by other services (-22.0%) and retail trade (-13.7%).
| Table 4. U.S. Establishment Survey Data | |||
|---|---|---|---|
| Indicator | Feb. | Apr. | Change |
| Total Non-farm Payrolls (millions) | 129.7 | 109.3 | -20.4 |
| Goods-producing | 21.2 | 18.8 | -2.4 |
| Service | 108.5 | 90.6 | -17.9 |
| Government | 22.7 | 21.7 | -1.0 |
| Average weekly hours | 34.4 | 34.2 | -0.2 |
| Average weekly earnings | $981.09 | $1,026.34 | $45.25 |
| Aggregate weekly payrolls (index) | 152.7 | 134.7 | -18.0 |
|
* Source: U.S. Department of Labor, Bureau of Labor Statistics
|
|||
| Table 5: Changes in Employment by Sector | |
|---|---|
| Sector | % chg. in employment between Feb. and Apr. |
| Leisure and hospitality | -48.3% |
| Other services/td> | -22.0% |
| Retail trade | -13.7% |
| Construction | -13.2% |
| Education and health services | -10.8% |
| Manufacturing | -10.6% |
| Transportation and warehousing | -10.4% |
| Information | -8.9% |
| Mining and logging | -7.98% |
| Wholesale trade | -6.16% |
| Government | -4.4% |
| Financial activities | -3.0% |
| Utilities | -0.5% |
|
* Source: U.S. Department of Labor, Bureau of Labor Statistics
|
|
What does all of this mean for the economy in Q2?
There is little doubt that the second quarter will be the worst quarter in recorded economic history for the U.S. However, estimates for how bad it will be, as well as which components of the economy will be hardest hit, vary widely. For example, the Blue Chip Economic Indicators Survey shows the top 10 forecasters predict Q2 GDP will contract by -17%, whereas the bottom 10 forecasters predict an average of -37% — a huge range. Part of this range is explained by having to decode not just what the extreme swings in data mean for the economy, but how the distortions discussed above translate into an understanding of broad economic activity. Many of the models used by forecasters are just not able to handle the peculiarities of the current situation.
To attempt to understand the overall impact on the economy, we return to a fundamental concept in economics, often referred to as Okun’s Law. This principle states that economic output is the result of people working, and as a consequence, data on who is working and their average level of productivity can be used to estimate overall output (e.g., GDP). As rule of thumb, the most basic version of Okun’s Law states that a one percent increase in the unemployment rate should result in about a two percent decline in output, but this form is not appropriate in the current environment.1 A better application utilizes the detailed establishment and income data provided in the Employment Situation Report (such as that reported in Table 4), which provides an index of aggregate weekly payrolls for the private sector.2 One major advantage of these data is that they account for the mix-shift in workers discussed above by including wages in the calculation.
Using an application of Okun’s Law and the index of aggregate weekly payrolls for April, we estimate that private sector GDP contracted -39.5% between February and April. The index is not available for public sector workers, but we can instead utilize government employment levels.3 From these data, we estimate that public sector output contracted roughly -16.5%. Taking the overall weights of the private and public sector in the economy, and making some other assumptions on continued activity, we estimate that total U.S. GDP will contract by about 35.4% in Q2 (again, this is at an annual rate).
Of course, our estimate has a wide confidence interval because of uncertainty about how May and June will evolve. A swift and effective restart of the economy could result in a better overall outcome. However, continued disruptions and job losses could further depress the economy. We feel that the bulk of the shock has passed and the good news will roughly offset the bad for the remainder of the quarter. Thus, our calculations based off of the April data provide a reasonable estimate of what will happen to overall economic output in Q2.
Where do we go from here?
Retail is a lynchpin. Consumer expenditures account for 70% of U.S. GDP and the data above show how disproportionately spending has been affected during the pandemic. So getting consumers out to shop is going to be key to restarting the economy. As retailers and restaurants gear up to welcome back customers, there are a few things to keep in mind. The business environment has undergone a significant changes since the coronavirus pandemic, and this will require retailers and restaurants to change how they operate.
Most important, the way retail organizations interact with their employees must adjust. Retail and restaurant service delivery depends upon the millions of workers employed in these sectors, and associates need to be able to deliver services safely. Safety is not merely a high-priority goal, but a nonnegotiable precondition to operate at this point. Customers are still wary of shopping in brick-and-mortar stores, so building confidence around their safety at physical retail locations is critical to the success of the reopening strategy. Any adverse event is likely to affect business outcomes severely. We are starting to see how important the perception of risk is as some states reopen nonessential retail operations, only to find empty stores.
In order to protect their customers’ and associates’ wellbeing, all firms need to either create or revamp their safety processes to ensure that business gets done in the safest possible way. Stores need to adopt new operating procedures to reinforce the importance of safety to individuals and organizations (e.g., team huddles at the beginning of each day to emphasize safety policies and procedures so they remain top of mind). The coronavirus is likely to influence worker and consumer psyches for years, and a process view will be required to survive. Such a view also implies that, when an adverse event does occur, managers need to determine where the process failed, rather than who blundered.
Finally, we would also emphasize that retailers approach their employees with a great deal of empathy. Unlike nurses, doctors and EMT personnel who signed up for hazardous work conditions, retail and restaurant employees did not take up their jobs knowing that they would have to manage the risks of a life-threatening disease. During these challenging times, retailers are going to be under tremendous pressure to cut costs. There is a risk that, as retailers prioritize expense reduction, they may inadvertently send the wrong message to employees, who may take their eyes off the safety ball, resulting in irreparable long-term losses.
Another second critical issue apparent in the recent data is a need to work through disruptions in the supply chain. Businesses are likely to need coordinated, targeted assistance to relieve supply chain bottlenecks, such as helping adapt processes according to best practices for each industry. Some adaptations will result from businesses learning as they go, or from outside expertise (e.g., consulting or broad sharing of best practices). However, some issues will require coordinated government action. One idea is for government to outfit “logistics swat teams” to identify and manage kinks in the supply chain that require new types of coordination across private sector businesses or the allocation of temporarily scarce inputs. In certain limited cases, it might be beneficial for a government authority to undertake temporary interventions to direct scarce supplies to the highest impact areas (e.g., PPE and other safety-related goods). Likewise, government assistance and information-sharing with infection and antibody testing will remain necessary to help reduce not just consumer anxiety, but also the odds of future supply chain disruptions (such as meat processing). Likewise, future government financial assistance should increasingly move toward providing support to business to make operational changes necessary for them to reopen and operate reliably. Some other countries, such as Germany, have had much better success at keeping manufacturing facilities operating.4
An even broader lesson from these reports and our forecast for U.S. GDP is that the human implications of a shutdown are both dire and disproportionately experienced by certain Americans. There are very real tradeoffs between the efforts to minimize the direct health implications of the virus and the need to carefully open businesses to alleviate human suffering along other dimensions.
Rather than allowing such a discussion to be mired in political rancor, this is exactly the time for evidence-based decision-making, assisted by the very experts who have received considerable scorn of late. We have hard questions to ask. How do we open the retail sector in a manner that is safe for workers and customers, yet profitable for firms? How should we protect critical nodes in our supply chain? How do we ensure that we learn the right lessons from previous policy efforts, such as the Payroll Protection Program for small businesses and their employees? Most importantly, in light of this challenging set of tradeoffs, how do we foster a willingness to engage in intelligent—and necessary—risk experimentation with certain restrictions going forward?
As we consider the policies designed to address these and other critical questions, one theme that clearly emerges is the importance of timely information. Government statistical agencies are providing imperfect, yet valuable, beacons along a treacherous journey, and they must be properly resourced. Data are essential public goods, and, if we are blind to their importance, we will struggle to navigate the heart-wrenching tradeoffs associated with the reopening process.
2 The index of aggregate weekly wages effectively measures the change in total payroll expenditures by industry and for the entire private sector. Data by industry are available on the Bureau of Labor Statistics website: https://www.bls.gov/news.release/empsit.t20.htm
3 As shown above, public sector employment declined, but much more modestly and there was likely less of a mix-shift in types of workers than in the private sector.
4 See for example, “How Germany Kept Its Factories Open During the Pandemic,” The Wall Street Journal, May 6, 2020 (https://www.wsj.com/articles/how-germany-kept-its-factories-open-during-the-pandemic-11588774844)