Is the U.S. Economy at a Boiling Point, or Just Simmering?
Part One of a Debate from Kenan Institute Experts (Read Part Two)
Is the U.S. economy overheated?
Business leaders and policymakers face a confusing set of signals about factors that determine the state of the U.S. economy, including a large rebound in consumer demand, the exponential jump in COVID-19 cases from the Omicron variant, mounting labor and supply chain shortages, and inflationary pressures not seen in decades. The state of the aggregate economy, while murky, carries extremely important implications for near-term business decisions as well as the stance of fiscal and monetary policy going forward. To effectively plan, business leaders tasked with managing scarce resources amid such a complicated environment yearn for clarity.
Today’s Kenan Insight serves as the first in a two-part point-counterpoint series, in which Kenan Institute Executive Director Greg Brown and Chief Economist Gerald Cohen hash out the arguments both for and against an overheating economy. This week, they tackle the question: Is the economy seriously overheated, or do current conditions primarily reflect a transitory imbalance associated with COVID-19 and supply chain disruptions?

Greg: In my view, the U.S. economy is boiling over! Let me explain my reasoning: At a fundamental level, an overheating economy means that aggregate demand exceeds aggregate supply. One way to estimate the imbalance is to compare demand as measured by actual gross domestic product (GDP) with the productive capacity of the economy, also called potential GDP. Potential GDP is essentially the sustainable level of aggregate production (i.e., supply) and depends on two key factors: the total number of people working and how productive those people are at their jobs.
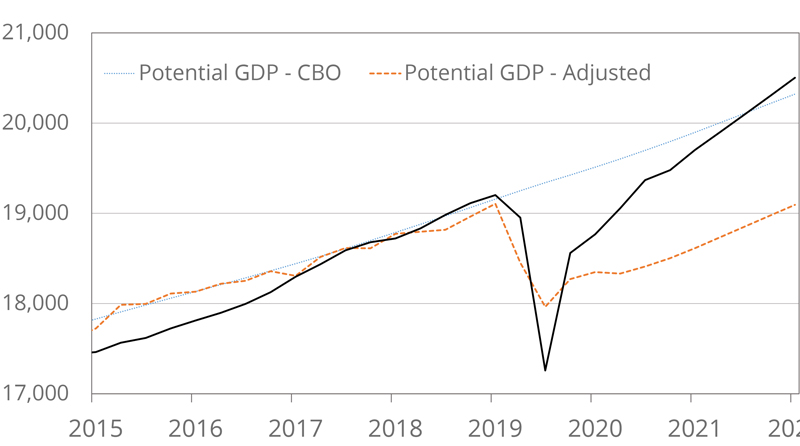
Potential GDP estimates from the Congressional Budget Office (CBO) show a steady upward trend based on estimated growth of the workforce and increased productivity of workers. The CBO estimates that potential GDP grew over the last couple of years an average of about 2% at an annual rate (see blue line in Figure 1). These numbers seem detached from the realities of what has happened to the economy, and especially in labor markets. Specifically, the productive capacity of the economy has dropped substantially since the onset of the pandemic as the labor force has contracted rather than expanded, as the CBO estimates assume. My estimates of potential GDP sit well below the CBO estimates – an average of about 6% lower over the last year (see orange line in Figure 1).
However, the degree of overheating is not determined by just the level of potential GDP, but the difference between potential and actual GDP – often called the “GDP Gap.” My year-end estimate of the gap is about 5.9% of GDP, and based on recent estimates of GDP growth for 2022, I estimate the gap will widen even further by the end of the year. If you buy into my estimates of potential GDP that have been revised down to reflect a smaller labor force, the U.S. economy has never been more overheated – and it is going to get worse in 2022.
Figure 1: Potential and Actual GDP (Billions of 2012 USD)
Gerald: As Greg indicates, the key to his view is whether you choose to adopt his adjusted estimates of potential GDP, which depend on many of the people who have left the labor force never returning to work and NO productivity growth. Those seem like very strong assumptions. Let’s consider the labor supply issue first.
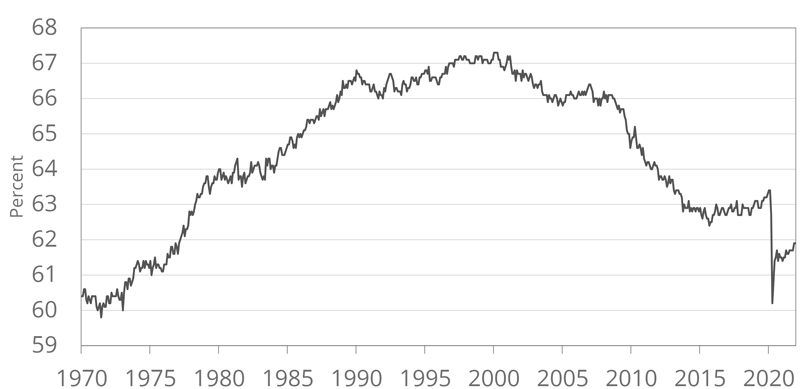
The civilian labor force has shrunk by 2.3 million since the beginning of the pandemic, while the relevant population (age 16 and older) has increased by 2.5 million. This means that the share of the population engaged in the job market has fallen substantially since the beginning of the pandemic. While it has rebounded from spring 2020 lows, the labor force participation rate currently stands 61.9%, a level we haven’t seen consistently since the mid-1970s when there was a surge in women entering the labor force (Figure 2). If the participation rate went up to 62.5% – still meaningfully below pre-pandemic levels and at late 1970s levels – Greg’s gap would shrink by more than two percentage points.
Figure 2: Labor Force Participation Rate
There are good reasons to believe that the participation rate will rise to that level. The participation rate for women aged 35-44 has been particularly hard hit, which is not surprising given the stories of women who are facing uncertain caregiving needs as a result of COVID-19. And, while there has been some shift in peoples work choices, as evidenced by the drop in participation of workers aged 55 and older, it is also hard to imagine that the rising wages we are seeing (up 4.7% in 2021) won’t bring some reluctant workers off the sidelines, especially as COVID-19 (hopefully) recedes.
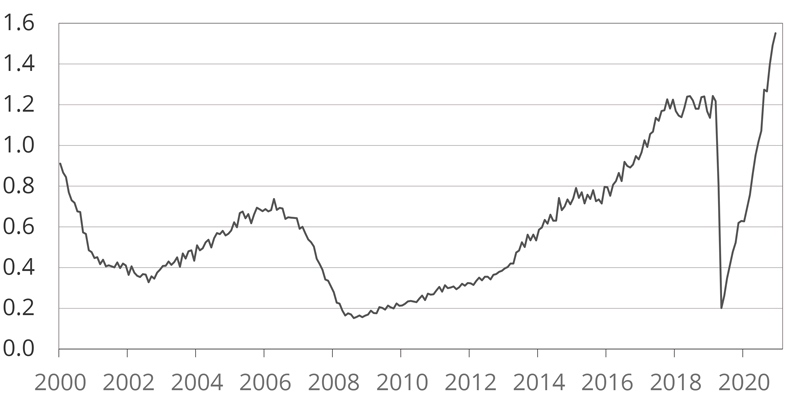
Greg: I agree that in the long run we will likely see labor force participation return to pre-pandemic levels. But this could take many years, just as it did during the recovery after the Great Financial Crisis. What matters most are the labor conditions in 2022, and they are tight by most measures. The most telling statistic describing the current shortage in labor markets comes from the Job Openings and Labor Turnover Survey (JOLTS) conducted by the Bureau of Labor Statistics. Recent JOLTS data show that the number of job openings per job seeker stands at 1.55, which is by far the largest value on record since the survey started in 2000 (see Figure 3). These data suggest that the accelerating wage pressures evident in the recent Employment Cost Index could just be the tip of the iceberg.
Figure 3: Job Openings per Job Seeker
There are other worrying signs about the labor market. These include the lowest level of initial claims for unemployment insurance since the 1960s, when there were many fewer people in the labor force, and an unemployment rate of 3.9%, which is below most estimates of equilibrium unemployment (i.e., the so-called non-accelerating inflationary rate of unemployment, or NAIRU). Altogether, there is little doubt in my mind that the labor market is overheated, at least currently, and will remain that way unless millions of new participants join the labor force very quickly in 2022.
The long-run unemployment rate in the U.S. is 5.8% and is sometimes used as a proxy for NAIRU. However, it is very difficult to estimate NAIRU currently because the pandemic has substantial changed the needed skillset of workers in the economy which likely increases NAIRU. On the other hand, the U.S. obtained quite low unemployment rates in the last two expansions without experiencing significant inflationary pressures.
Gerald: Still, labor force growth is not really where the action is. Most forecasters of potential growth have been penciling in weak labor force growth for years as a result of limited population growth. The key for potential growth is productivity, which has grown at a 1.6% annual rate since the beginning of the pandemic. This is on par with the pre-COVID level and acceleration from the underperformance of mid-2010s. If you apply this actual productivity growth and my assumed labor force participation rate to the level of potential estimated by Greg at the end of 2019, today’s positive output gap shrinks to just 0.2% (vs. Greg’s 5.9%). If you believe the current labor force is the best we can muster, then the gap is 1.2% of current GDP.
And, there are numerous reasons to be optimistic about a continuation of productivity growth. Innovation and investment in labor saving technologies are the key to future productivity, and growth in standards of living. Capital investment in high tech equipment and software has accelerated since COVID-19 began – up at a 10.6% annual rate. This is the fastest pace since 2008. Meanwhile, investment in research and development (R&D) has grown at a 4.6% annual rate since the end of 2019, and 10% during the last year alone. These data suggests that rather than a productivity desert, we could experience a productivity resurgence as COVID-19 has forced us to adopt existing technologies, such as Zoom, and develop new technologies, such as mRNA vaccines. If productivity is on an accelerating path, then the output gap could be -5.9% rather than +5.9%!
Greg: We see the prospects for productivity very differently. While productivity did increase in 2020, more recently productivity growth has stalled. While we hear stories about how the pandemic has forced businesses to find new and more efficient ways of operating, these are the exception and not the rule. To the contrary, supply chain problems are increasingly forcing more and more businesses to resort to inefficient workarounds or even forego production. Productivity is notoriously difficult to measure, but these struggles facing businesses in the U.S. are starting to show up in the official statistics: labor productivity over the last four quarters has fallen -0.5%.2
Furthermore, the degree of R&D and capital investment is a potential long-term benefit for the economy, but one of the great puzzles in economics is why tremendous investments in technology over the last few decades have not translated into higher productivity growth.3 Maybe this time will be different since the pandemic has forced many businesses to rapidly adapt, but I don’t see that in the data yet.
Perhaps the most concerning indicator is inflation. It seems very clear to me that we are in a position of too many dollars chasing too few goods – another way of defining overheating. We now have inflation reaching its highest level in four decades.
Gerald: There is no doubt that the pickup in inflation is concerning and has been larger and lasted longer than both private sector and Fed forecasters anticipated. In contrast to the pre-COVID period – when inflation remained consistently below the Fed’s 2% target and prognosticators were worried about Japan-style deflation – the risks to inflation are clearly to upside. However, there are three reasons to be optimistic about the medium-term path for inflation (i.e., by the end of 2022 and into 2023, inflation will have decelerated to around 2%), including supply shortages abating in response to and in combination with a likely shift in demand from high-priced goods toward services, a loose relationship between the output gap and inflation, and still-muted inflation expectations.
First, most of the inflation reflects a combination of a COVID-driven shift in demand toward goods and housing and supply shortages. Families stopped going to restaurants and started remodeling their kitchens. Meanwhile, appliance makers had their factories shut down and then when they restarted, they ran at a lower capacity because of pandemic precautions. As a result, inflation for goods like dishwashers and cars was up 10.7% in 2021, the fastest pace in decades (see Figure 4). Manufacturers are responding to these price signals – though Omicron has thrown some sand in those gears – but as supply shortages abate, goods inflation should follow suit.
Figure 4: Goods and Services CPI
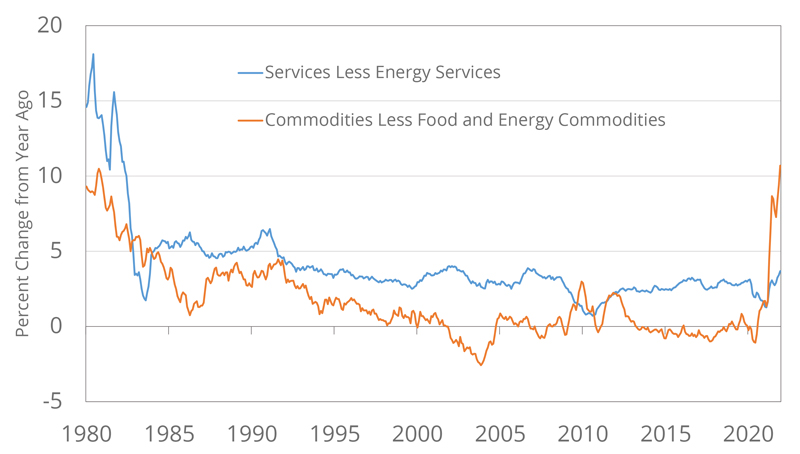
Some of these supply-demand imbalances have bled into the services sector. For example, rental car prices came from a combination of rental car companies selling off their fleets to remain afloat during the spring 2020, then facing an inability to rebuild fleets because of the chip shortages. But overall, service price inflation has remained relatively muted, with recent acceleration more about a return to trend after below trend growth.
Moreover, when COVID-19 subsides, there will be a shift in demand back to services. As more people dine out and take more extensive vacations they may regret some of their goods purchases. I wouldn’t be surprised to see cancelled backlogged orders of furniture and appliances, and lightly used boats or exurbs homes on the market at cut rate prices. This would lead to a return to the goods deflation we experienced for much of the last 20 years.
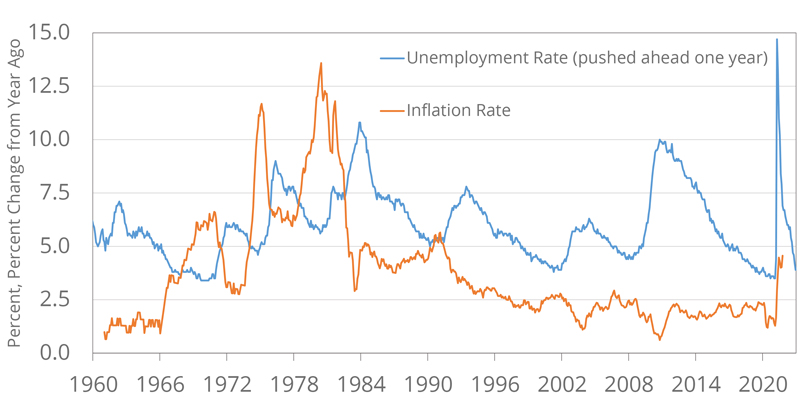
Second, even if you believe Greg’s output gap estimate, the relationship between the output gap/unemployment rate and inflation – known as the Phillips Curve – has become extremely attenuated. Since the great disinflation of the early 1980s, the relationship has effectively broken down. Note how inflation didn’t budge when the unemployment rate fell below 4% in 2019, and the limited decline in inflation following the Great Recession of 2008-09 in comparison to the early 1980s (see Figure 4).
Figure 5: Unemployment vs. Core Inflation
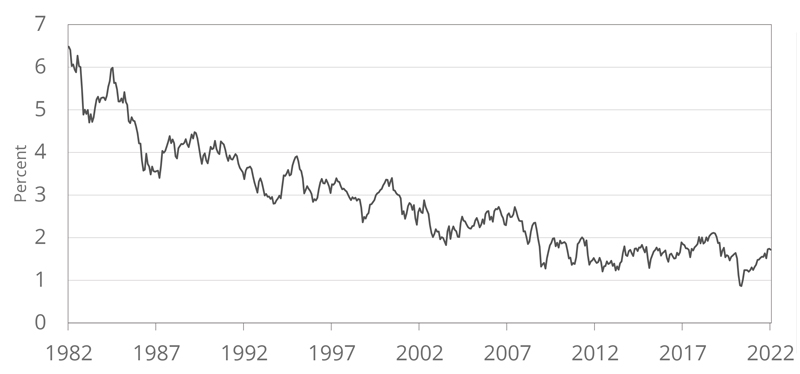
This points to the third reason, that the biggest driver of inflation at this time is inflation expectations, which remain well anchored.4 Ten-year Treasury yields wouldn’t be around 1.8% if market participants expected a period of high inflation. At the same time, household and business surveys expect modest inflation in the medium-term despite high oil prices and rising wages. Short term consumer expectations tend to respond closely to energy prices, while businesses seem to be saying that they need to raise wages to attract workers, but these are more of a one-time increase rather than permanent wage inflation. Putting this all together, the Cleveland Fed’s inflation expectations measures remains at or below pre-pandemic levels (see Figure 5). That said, inflation expectations are contingent on the Fed illustrating it will do what is necessary and inflation actually decelerating. This is why the Fed has signaled a shift toward tightening and I will remain on edge until we see clear signs of disinflation.
Figure 6: Cleveland Fed 5-Year Expected Inflation
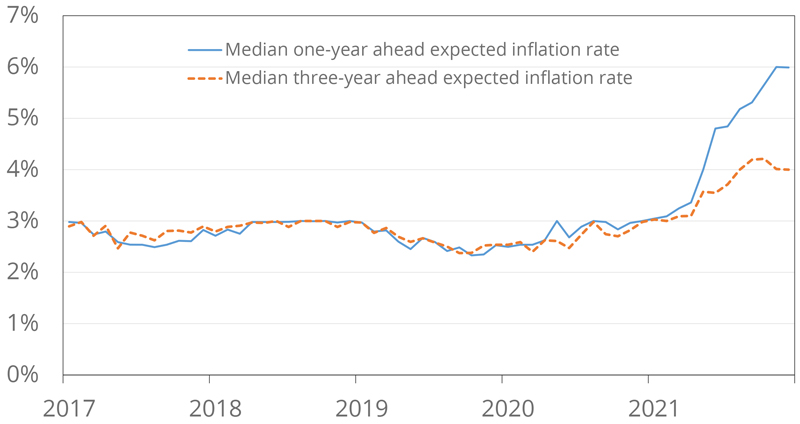
Greg: I don’t feel as complacent about services inflation given the most recent data. Inflation in the service sector experienced a dramatic spike toward the end of 2021. The inflation in services is widespread as well: housing, healthcare and personal services (i.e haircuts) inflation all clocked in at an annual rate of more than 4% in the fourth quarter.5 And finally, the degree that consumer inflation expectations are anchored seems dependent on the survey. In contrast to the Cleveland Fed, the New York Fed’s survey shows a big uptick in expectations over the last year, more so for one year out, but three-year expectations are now around 4% – well above the pre-pandemic level and the Fed’s 2% target (Figure 7).
Figure 7: Inflation Expectations (NY Fed Survey of Consumer Expectations)
In sum, this discussion highlights that there is a remarkable confluence of forces at play. One fact upon which we can agree is that the drivers of the U.S. economy going forward are characterized by a significant degree of uncertainty. While the comprehensive answer to the question of how overheated the U.S. economy is remains frustratingly elusive, we provide a framework to help better appreciate the context. In part two of this exchange – featured in next week’s Kenan Insight – we will explore the implications of this debate for policymakers, both monetary and fiscal, as well as for business leaders tasked with managing scarce resources in an intellectually challenging time.
1 The long-run unemployment rate in the U.S. is 5.8% and is sometimes used as a proxy for NAIRU.1 However, it is very difficult to estimate NAIRU currently because the pandemic has substantial changed the needed skillset of workers in the economy which likely increases NAIRU. On the other hand, the U.S. obtained quite low unemployment rates in the last two expansions without experiencing significant inflationary pressures.
2 Data are through 2021:Q3 which are the most recent data available at the time of writing.
3 See for example, Brynjolfsson, E., Benzell, S., & Rock, D. (2020, November). Understanding and Addressing the Modern Productivity Paradox. MIT Work of the Future. https://workofthefuture.mit.edu/wp-content/uploads/2020/11/2020-Research-Brief-Brynjolfsson-Benzell-Rock.pdf.
4 Powell, T. & Wessel, D. (2020). What are inflation expectations? Why do they matter? Brookings. https://www.brookings.edu/blog/up-front/2020/11/30/what-are-inflation-expectations-why-do-they-matter/
5 See U.S. Bureau of Labor Statistics.(2022).Consumer Price Index [data file]. https://www.bls.gov/news.release/cpi.nr0.htm.

